Videos
Logistic growth Scientists often use the logistic growth function
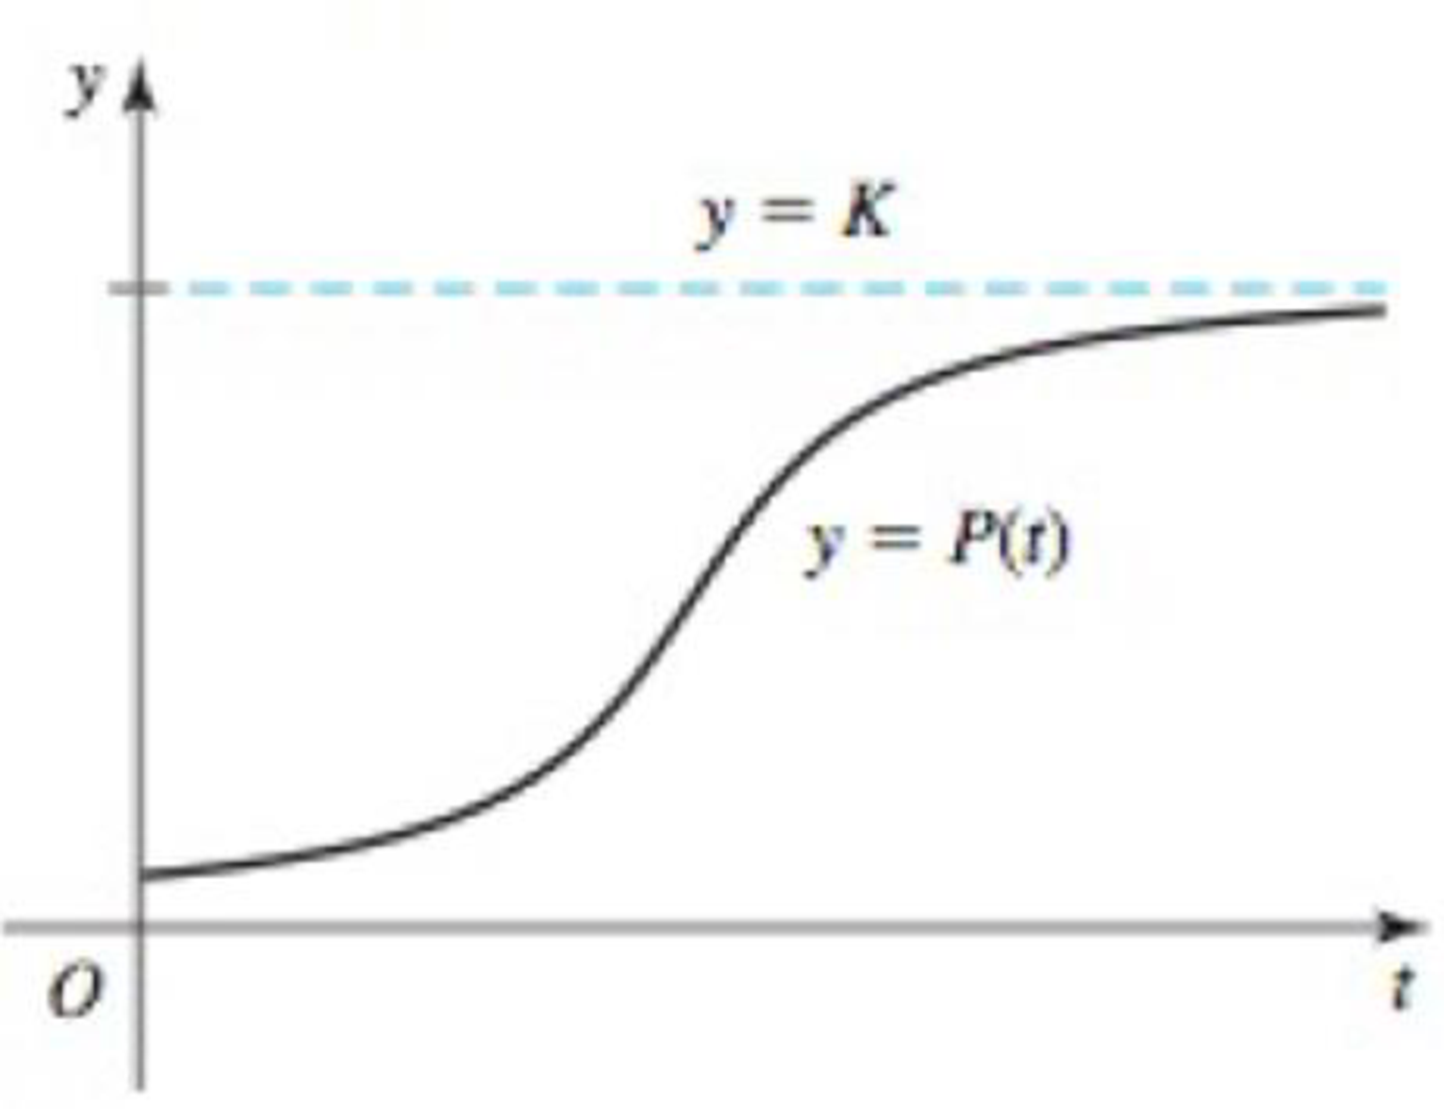
94. World population (part 1) The population of the world reached 6 billion in 1999 (t = 0). Assume Earth’s carrying capacity is 15 billion and the base growth rate is r0 = 0.025 per year.
- a. Write a logistic growth function for the world’s population (in billions) and graph your equation on the interval 0 ≤ t ≤ 200 using a graphing utility.
- b. What will the population be in the year 2020? When will it reach 12 billion?
Want to see the full answer?
Check out a sample textbook solution
Chapter 3 Solutions
Calculus: Early Transcendentals, 2nd Edition
Additional Math Textbook Solutions
Precalculus (10th Edition)
Calculus & Its Applications (14th Edition)
Glencoe Math Accelerated, Student Edition
Thomas' Calculus: Early Transcendentals (14th Edition)
Calculus and Its Applications (11th Edition)
Precalculus Enhanced with Graphing Utilities (7th Edition)


- In the exponential growth or decay function y=y0ekt, what does y0 represent? What does k represent?arrow_forwardWhat is the carrying capacity for a population modeled by the logistic equation P(t)=250,0001+499e0.45t ? initial population for the model?arrow_forwardWhat is the y -intercept of the logistic growth model y=c1+aerx ? Show the steps for calculation. What does this point tell us about the population?arrow_forward
- Table 6 shows the population, in thousands, of harbor seals in the Wadden Sea over the years 1997 to 2012. a. Let x represent time in years starting with x=0 for the year 1997. Let y represent the number of seals in thousands. Use logistic regression to fit a model to these data. b. Use the model to predict the seal population for the year 2020. c. To the nearest whole number, what is the limiting value of this model?arrow_forwardThe table shows the mid-year populations (in millions) of five countries in 2015 and the projected populations (in millions) for the year 2025. (a) Find the exponential growth or decay model y=aebt or y=aebt for the population of each country by letting t=15 correspond to 2015. Use the model to predict the population of each country in 2035. (b) You can see that the populations of the United States and the United Kingdom are growing at different rates. What constant in the equation y=aebt gives the growth rate? Discuss the relationship between the different growth rates and the magnitude of the constant.arrow_forward

 Calculus For The Life SciencesCalculusISBN:9780321964038Author:GREENWELL, Raymond N., RITCHEY, Nathan P., Lial, Margaret L.Publisher:Pearson Addison Wesley,
 Algebra & Trigonometry with Analytic GeometryAlgebraISBN:9781133382119Author:SwokowskiPublisher:Cengage
 Glencoe Algebra 1, Student Edition, 9780079039897...AlgebraISBN:9780079039897Author:CarterPublisher:McGraw Hill