Concept explainers
Videos
29. Advertising A small manufacturing firm collected the following data on advertising expenditures A (in thousands of dollars) and total revenue R (in thousands of dollars).
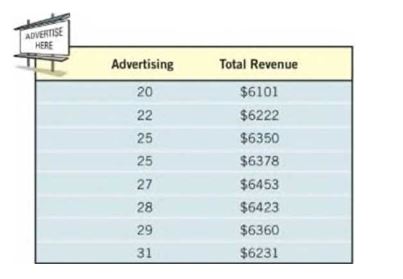
(a) Draw a
(b) The quadratic function of best fit to these data is
Use this function to determine the optimal level of advertising.
(c) Use the function to predict the total revenue when the optimal level of advertising is spent.
(d) Use a graphing utility to verify that the function given in part (b) is the quadratic function of best fit.
(e) Use a graphing utility to draw a scatter diagram of the data and then graph the quadratic function of best fit on the scatter diagram.
Want to see the full answer?
Check out a sample textbook solution
Chapter 3 Solutions
PRECALCULUS:ENHANCED.(LOOSE)>CUSTOM<
Additional Math Textbook Solutions
Calculus and Its Applications (11th Edition)
Thomas' Calculus: Early Transcendentals (14th Edition)
Calculus, Single Variable: Early Transcendentals (3rd Edition)
University Calculus: Early Transcendentals (3rd Edition)


- Traffic Accidents The following table shows the cost C of traffic accidents. in cents per vehicle-mile, as a function of vehicular speed s, in miles per hour, for commercial vehicles driving at night on urban streets. Speed s 20 25 30 35 40 45 50 Cost C 1.3 0.4 0.1 0.3 0.9 2.2 5.8 The rate of vehicular involvement in traffic accidents per vehicle-mile can be modeled as a quadratic function of vehicular speed s, and the cost per vehicular involvement is roughly a linear function of s, so we expect that C the product of these two functions can be modeled as a cubic function of s. a. Use regression to find a cubic model for the data. Keep two decimal places for the regression parameters written in scientific notation. b. Calculate C(42) and explain what your answer means in practical terms. c. At what speed is the cost of traffic accidents for commercial vehicles driving at night on urban streets at a minimum? Consider speeds between 20 and 50 miles per hour.arrow_forwardA company determines that its weekly profit from manufacturing and selling x units of a certain item is given by Px=-x3+3x2+2880x-500. Use a graphing utility to find the weekly production rate that will maximize the profit.arrow_forwardIn Exercises 5-8, match the quadratic function with its graph. [ Thegraphsarelabeled(a),(b),(c),and(d). ] f(x)=(x4)2arrow_forward
 Functions and Change: A Modeling Approach to Coll...AlgebraISBN:9781337111348Author:Bruce Crauder, Benny Evans, Alan NoellPublisher:Cengage Learning
 Algebra & Trigonometry with Analytic GeometryAlgebraISBN:9781133382119Author:SwokowskiPublisher:Cengage
 College Algebra (MindTap Course List)AlgebraISBN:9781305652231Author:R. David Gustafson, Jeff HughesPublisher:Cengage Learning
 Algebra for College StudentsAlgebraISBN:9781285195780Author:Jerome E. Kaufmann, Karen L. SchwittersPublisher:Cengage Learning
 Big Ideas Math A Bridge To Success Algebra 1: Stu...AlgebraISBN:9781680331141Author:HOUGHTON MIFFLIN HARCOURTPublisher:Houghton Mifflin Harcourt