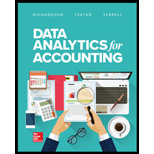
Data Analytics For Accounting
19th Edition
ISBN: 9781260375190
Author: RICHARDSON, Vernon J., Teeter, Ryan, Terrell, Katie
Publisher: Mcgraw-hill Education,
expand_more
expand_more
format_list_bulleted
Question
Chapter 4, Problem 10MCQ
To determine
Identify the chart which is most appropriate chart while showing a relationship between two variables.
Expert Solution & Answer
Want to see the full answer?
Check out a sample textbook solution
Students have asked these similar questions
q4-
What can be used to analyse the relationship between two categorical or qualitative variables? Choose all that apply.
Select one or more:
a.
Scatterplots
b.
Cramer's Coefficient
c.
Correlation coefficient
d.
Contingency tables
q5-
In which of the following charts the X-axis represents outcomes and the Y-axis represents the number of times or the percentage each outcome occurs in the dataset?
a.
A combo-chart
b.
A scatter plot
c.
A histogram
d.
A boxplot
Perform the following:
a. horizontal analysis
b. vertical analysis
c. ratio analysis
d. interpret the results
Chapter 4 Solutions
Data Analytics For Accounting
Ch. 4 - Prob. 1MCQCh. 4 - In the late 1960s, Ed Altman developed a model to...Ch. 4 - Justin Zobel suggests that revising your writing...Ch. 4 - Prob. 4MCQCh. 4 - The Fahrenheit scale of temperature measurement...Ch. 4 - _______ data would be considered the least...Ch. 4 - ________ data would be considered the most...Ch. 4 - Prob. 8MCQCh. 4 - Exhibit 4-8 gives chart suggestions for what data...Ch. 4 - Prob. 10MCQ
Ch. 4 - Prob. 1DQCh. 4 - Prob. 2DQCh. 4 - Prob. 3DQCh. 4 - Prob. 4DQCh. 4 - Prob. 5DQCh. 4 - Based on the data from datavizcatalogue.com, how...Ch. 4 - Prob. 7DQCh. 4 - Prob. 8DQCh. 4 - Prob. 9DQCh. 4 - Prob. 1PCh. 4 - Prob. 2PCh. 4 - Prob. 3PCh. 4 - According to Exhibit 4-8, which is the best chart...Ch. 4 - Prob. 5PCh. 4 - Prob. 6PCh. 4 - Prob. 7P
Knowledge Booster
Similar questions
- do a tabular analysisarrow_forwardCan you show how to do covariance by hand?arrow_forwardFive observations taken for two variables follow. a. Develop a scatter diagram with x on the horizontal axis. b. What does the scatter diagram developed in part a indicate about the relationship between the two variables? c. Compute and interpret the sample covariance. d. Compute and interpret the sample correlation coefficient.arrow_forward
arrow_back_ios
arrow_forward_ios
Recommended textbooks for you
 Essentials of Business Analytics (MindTap Course ...StatisticsISBN:9781305627734Author:Jeffrey D. Camm, James J. Cochran, Michael J. Fry, Jeffrey W. Ohlmann, David R. AndersonPublisher:Cengage Learning
 Principles of Cost AccountingAccountingISBN:9781305087408Author:Edward J. Vanderbeck, Maria R. MitchellPublisher:Cengage Learning
 Managerial AccountingAccountingISBN:9781337912020Author:Carl Warren, Ph.d. Cma William B. TaylerPublisher:South-Western College Pub
 Financial And Managerial AccountingAccountingISBN:9781337902663Author:WARREN, Carl S.Publisher:Cengage Learning,

Essentials of Business Analytics (MindTap Course ...
Statistics
ISBN:9781305627734
Author:Jeffrey D. Camm, James J. Cochran, Michael J. Fry, Jeffrey W. Ohlmann, David R. Anderson
Publisher:Cengage Learning

Principles of Cost Accounting
Accounting
ISBN:9781305087408
Author:Edward J. Vanderbeck, Maria R. Mitchell
Publisher:Cengage Learning


Managerial Accounting
Accounting
ISBN:9781337912020
Author:Carl Warren, Ph.d. Cma William B. Tayler
Publisher:South-Western College Pub

Financial And Managerial Accounting
Accounting
ISBN:9781337902663
Author:WARREN, Carl S.
Publisher:Cengage Learning,