
Essentials Of Business Analytics
1st Edition
ISBN: 9781285187273
Author: Camm, Jeff.
Publisher: Cengage Learning,
expand_more
expand_more
format_list_bulleted
Concept explainers
Videos
Textbook Question
Chapter 4, Problem 12P
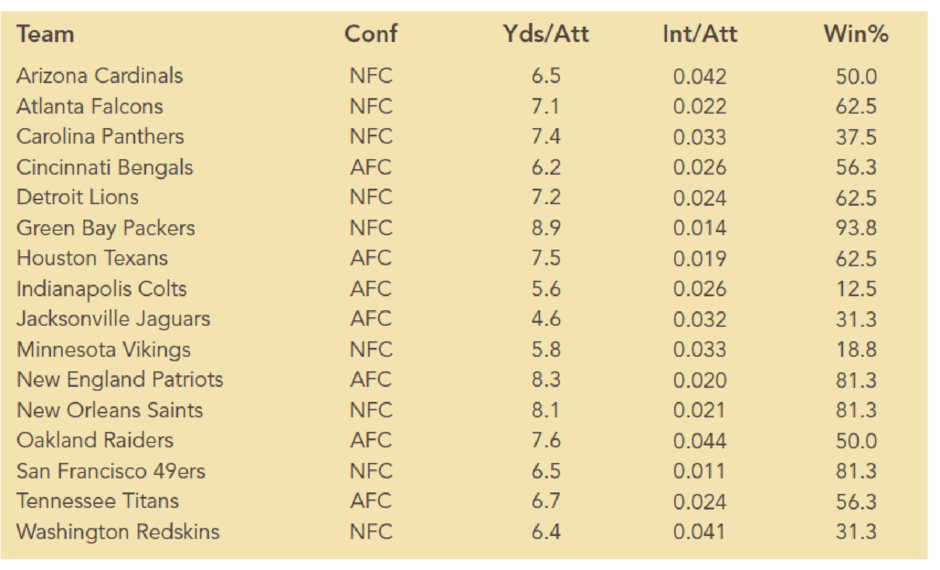
The National Football League (NFL) records a variety of performance data for individuals and teams. To investigate the importance of passing on the percentage of games won by a team, the following data show the conference (Conf), average number of passing yards per attempt (Yds/Att), the number of interceptions thrown per attempt (Int/Att), and the percentage of games won (Win%) for a random sample of 16 NFL teams for the 2011 season (NFL web site, February 12, 2012).
- a. Develop the estimated regression equation that could be used to predict the percentage of games won, given the average number of passing yards per attempt. What proportion of variation in the sample values of proportion of games won does this model explain?
- b. Develop the estimated regression equation that could be used to predict the percentage of games won, given the number of interceptions thrown per attempt. What proportion of variation in the sample values of proportion of games won does this model explain?
- c. Develop the estimated regression equation that could be used to predict the percentage of games won, given the average number of passing yards per attempt and the number of interceptions thrown per attempt. What proportion of variation in the sample values of proportion of games won does this model explain?
- d. The average number of passing yards per attempt for the Kansas City Chiefs during the 2011 season was 6.2, and the team’s number of interceptions thrown per attempt was 0.036. Use the estimated regression equation developed in part (c) to predict the percentage of games won by the Kansas City Chiefs during the 2011 season. Compare your prediction to the actual percentage of games won by the Kansas City Chiefs. (Note: For the 2011 season, the Kansas City Chiefs’ record was 7 wins and 9 losses.)
- e. Did the estimated regression equation that uses only the average number of passing yards per attempt as the independent variable to predict the percentage of games won provide a good fit?
Expert Solution & Answer
Want to see the full answer?
Check out a sample textbook solution
Chapter 4 Solutions
Essentials Of Business Analytics
Ch. 4 - Bicycling World, a magazine devoted to cycling,...Ch. 4 - In a manufacturing process the assembly line speed...Ch. 4 - Jensen Tire Auto is deciding whether to purchase...Ch. 4 - A sociologist was hired by a large city hospital...Ch. 4 - The regional transit authority for a major...Ch. 4 - A marketing professor at Givens College is...Ch. 4 - The Dow Jones Industrial Average (DJIA) and the...Ch. 4 - The Toyota Camry is one of the best-selling cars...Ch. 4 - Dixie Showtime Movie Theaters, Inc., owns and...Ch. 4 - Prob. 10P
Ch. 4 - The American Association of Individual Investors...Ch. 4 - The National Football League (NFL) records a...Ch. 4 - Johnson Filtration. Inc., provides maintenance...Ch. 4 - A study investigated the relationship between...Ch. 4 - The U.S. Department of Energys Fuel Economy Guide...Ch. 4 - A highway department is studying the relationship...Ch. 4 - A sample containing years to maturity and...Ch. 4 - In 2011, home prices and mortgage rates fell so...Ch. 4 - A recent 10-year study conducted by a research...Ch. 4 - The Scholastic Aptitude Test (or SAT) is a...Ch. 4 - Consider again the example introduced in Section...Ch. 4 - Alumni donations are an important source of...
Knowledge Booster


Learn more about
Need a deep-dive on the concept behind this application? Look no further. Learn more about this topic, statistics and related others by exploring similar questions and additional content below.Recommended textbooks for you
 Glencoe Algebra 1, Student Edition, 9780079039897...AlgebraISBN:9780079039897Author:CarterPublisher:McGraw Hill
 Holt Mcdougal Larson Pre-algebra: Student Edition...AlgebraISBN:9780547587776Author:HOLT MCDOUGALPublisher:HOLT MCDOUGAL
 Big Ideas Math A Bridge To Success Algebra 1: Stu...AlgebraISBN:9781680331141Author:HOUGHTON MIFFLIN HARCOURTPublisher:Houghton Mifflin Harcourt
Glencoe Algebra 1, Student Edition, 9780079039897...
Algebra
ISBN:9780079039897
Author:Carter
Publisher:McGraw Hill
Holt Mcdougal Larson Pre-algebra: Student Edition...
Algebra
ISBN:9780547587776
Author:HOLT MCDOUGAL
Publisher:HOLT MCDOUGAL
Big Ideas Math A Bridge To Success Algebra 1: Stu...
Algebra
ISBN:9781680331141
Author:HOUGHTON MIFFLIN HARCOURT
Publisher:Houghton Mifflin Harcourt
The Shape of Data: Distributions: Crash Course Statistics #7; Author: CrashCourse;https://www.youtube.com/watch?v=bPFNxD3Yg6U;License: Standard YouTube License, CC-BY
Shape, Center, and Spread - Module 20.2 (Part 1); Author: Mrmathblog;https://www.youtube.com/watch?v=COaid7O_Gag;License: Standard YouTube License, CC-BY
Shape, Center and Spread; Author: Emily Murdock;https://www.youtube.com/watch?v=_YyW0DSCzpM;License: Standard Youtube License