
ELEMENTARY STATISTICS(LL)(FD)
3rd Edition
ISBN: 9781260707458
Author: Navidi
Publisher: MCGRAW-HILL CUSTOM PUBLISHING
expand_more
expand_more
format_list_bulleted
Concept explainers
Videos
Textbook Question
Chapter 4, Problem 1CS
The following table, reproduced from the chapter introduction, presents the rate and unemployment rate, both in percent, for the years 1988-2015.
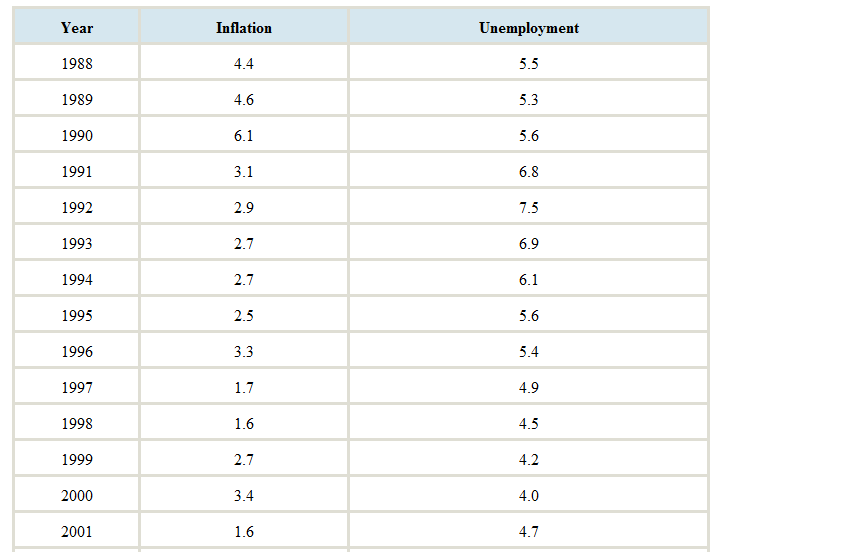
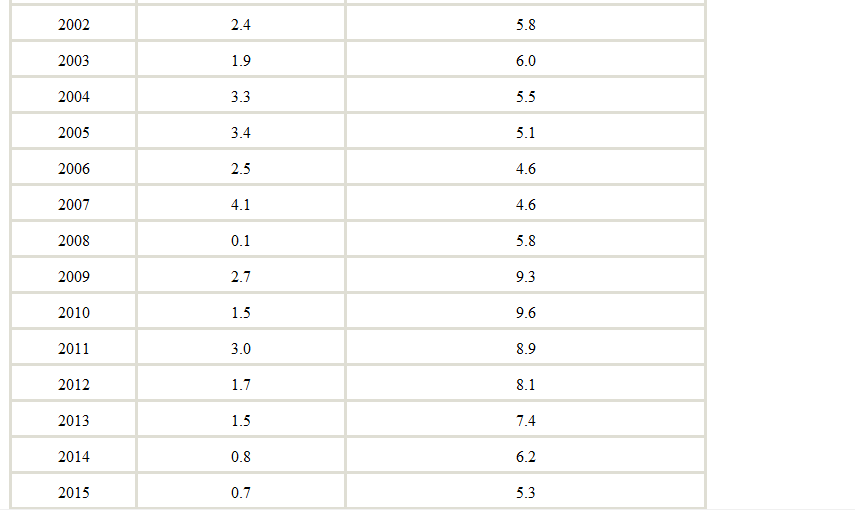
We will investigate some methods for predicting unemployment. First, we will try to predict the unemployment rate from the rate.
Construct a
Expert Solution & Answer
Want to see the full answer?
Check out a sample textbook solution
Students have asked these similar questions
The following data give the yearly inflation rate and money supply growthrate (both measured in percentage) for 51 countries. A simple regression of Infla-tion on Growth yields the following information from RegressIt output:
(a) What is the linear relationship implied by these data?
(b) For a country with an 6% money supply growth, what would be theexpected inflation? (This means Growth= 6 as it is measured in percentage.)
(c) A simplistic monetarist claims that a 1% increase in the money supplygrowth rate would result in a corresponding 1% increase in inflation. In otherwords, for the relationship of Inflation = β0 + β1Growth, the null hypothesis isβ1 = 1. Do the regression results support this null hypothesis?
Fungal Growth Because of the time that many people spend
indoors, there is a concern about the health risk of being ex-
posed to harmful fungi that thrive in buildings. The risk appears
to increase in damp environments. Researchers have discov-
ered that by controlling both the temperature and the relative
humidity in a building, the growth of the fungus A. versicolor
can be limited. The relationship between temperature and rela-
tive humidity, which limits growth, can be described by
R(T) = -0.00007T³ + 0.0401T² – 1.65727 + 97.086,
15 < T < 46,
where R(T) is the relative humidity (in percent) and T is the
temperature (in degrees Celsius). Find the temperature at which
the relative humidity is minimized. Source: Applied and Envi-
ronmental Microbiology.
We want to understand the relationship between sales growth rates (s) and project FCF growth
rates (g).
This is useful to think about, because in our spreadsheet models we often need an estimate
of g but when we look for analyst forecasts, they often just apply to s.
We consider a hypothetical firm in which there are Sales, COGS, Depreciation, Taxes, ONWC,
and CAPEX occurring each year.
You know that sales growth is constant and equals s.
You further know that in any given year, COGS/Sales-c, the tax rate is p, the ratio of ONWC to
Sales is n, and CAPEX-Depreciation, and Depreciation/Sales-d. s, c, p, n, and d are constants
(i.e., fixed parameters that don't change over time).
Perform an algebraic series of calculations. Start with FCF = (Sales - COGS - DA - Taxes -
etc). Simplify the expression until it is in the form Sales. *((1-c-d)(1-p)-s/(1+s)*n).
Chapter 4 Solutions
ELEMENTARY STATISTICS(LL)(FD)
Ch. 4.1 - In Exercises 9-12, fill in each blank with the...Ch. 4.1 - In Exercises 9-12, fill in each blank with the...Ch. 4.1 - In Exercises 9-12, fill in each blank with the...Ch. 4.1 - In Exercises 9-12, fill in each blank with the...Ch. 4.1 - Prob. 13ECh. 4.1 - Prob. 14ECh. 4.1 - In Exercises 13-16, determine whether the...Ch. 4.1 - In Exercises 13-16, determine whether the...Ch. 4.1 - In Exercises 17-20, compute the correlation...Ch. 4.1 - In Exercises 17-20, compute the correlation...
Ch. 4.1 - In Exercises 17-20, compute the correlation...Ch. 4.1 - In Exercises 17-20, compute the correlation...Ch. 4.1 - In Exercises 21-24, determine whether the...Ch. 4.1 - In Exercises 21-24, determine whether the...Ch. 4.1 - In Exercises 21-24, determine whether the...Ch. 4.1 - In Exercises 21-24, determine whether the...Ch. 4.1 - In Exercises 25-30, determine whether the...Ch. 4.1 - In Exercises 25-30, determine whether the...Ch. 4.1 - In Exercises 25-30, determine whether the...Ch. 4.1 - In Exercises 25-30, determine whether the...Ch. 4.1 - In Exercises 25-30, determine whether the...Ch. 4.1 - In Exercises 25-30, determine whether the...Ch. 4.1 - Price of eggs and milk: The following table...Ch. 4.1 - Government funding: The following table presents...Ch. 4.1 - Pass the ball: The following table lists the...Ch. 4.1 - Carbon footprint: Carbon dioxide (CO2) is produced...Ch. 4.1 - Foot temperatures: Foot ulcers are a common...Ch. 4.1 - Mortgage payments: The following table presents...Ch. 4.1 - Blood pressure: A blood pressure measurement...Ch. 4.1 - Prob. 38ECh. 4.1 - Police and crime: In a survey of cities in the...Ch. 4.1 - Age and education: A survey of U.S. adults showed...Ch. 4.1 - Whats the correlation? In a sample of adults, the...Ch. 4.1 - Prob. 42ECh. 4.1 - Changing means and standard deviations: A small...Ch. 4.2 - In Exercises 5-7, fill in each blank with the...Ch. 4.2 - In Exercises 5-7, fill in each blank with the...Ch. 4.2 - In Exercises 5-7, fill in each blank with the...Ch. 4.2 - Prob. 8ECh. 4.2 - Prob. 9ECh. 4.2 - Prob. 10ECh. 4.2 - Prob. 11ECh. 4.2 - Prob. 12ECh. 4.2 - In Exercises 13-16, compute the least-squares...Ch. 4.2 - In Exercises 13-16, compute the least-squares...Ch. 4.2 - In Exercises 13-16, compute the least-squares...Ch. 4.2 - In Exercises 13-16, compute the least-squares...Ch. 4.2 - Compute the least-squares regression he for...Ch. 4.2 - Compute the least-squares regression he for...Ch. 4.2 - In a hypothetical study of the relationship...Ch. 4.2 - Assume in a study of educational level in years...Ch. 4.2 - Price of eggs and milk: The following table...Ch. 4.2 - Government funding: The following table presents...Ch. 4.2 - Pass the ball: The following table lists the...Ch. 4.2 - Carbon footprint: Carbon dioxide (CO2) is produced...Ch. 4.2 - Foot temperatures: Foot ulcers are a common...Ch. 4.2 - Mortgage payments: The following table presents...Ch. 4.2 - Blood pressure: A blood pressure measurement...Ch. 4.2 - Butterfly wings: Do larger butterflies live...Ch. 4.2 - Interpreting technology: The following display...Ch. 4.2 - Interpreting technology: The following display...Ch. 4.2 - Interpreting technology: The following MINITAB...Ch. 4.2 - Interpreting technology: The following MINITAB...Ch. 4.2 - Prob. 33ECh. 4.2 - Prob. 34ECh. 4.2 - Least-squares regression line for z-scores: The...Ch. 4.3 - In Exercises 5-10, fill in each blank with the...Ch. 4.3 - In Exercises 5-10, fill in each blank with the...Ch. 4.3 - In Exercises 5-10, fill in each blank with the...Ch. 4.3 - In Exercises 5-10, fill in each blank with the...Ch. 4.3 - In Exercises 5-10, fill in each blank with the...Ch. 4.3 - Prob. 10ECh. 4.3 - Prob. 11ECh. 4.3 - In Exercises 11-14, determine whether the...Ch. 4.3 - Prob. 13ECh. 4.3 - In Exercises 11-14, determine whether the...Ch. 4.3 - For the following data set: Compute the...Ch. 4.3 - For the following data set: Compute the...Ch. 4.3 - For the following data set: Compute the...Ch. 4.3 - For the following data set: Compute the...Ch. 4.3 - Prob. 19ECh. 4.3 - Prob. 20ECh. 4.3 - Prob. 21ECh. 4.3 - Prob. 22ECh. 4.3 - Hot enough for you? The following table presents...Ch. 4.3 - Presidents and first ladies: The presents the ages...Ch. 4.3 - Mutant genes: In a study to determine whether the...Ch. 4.3 - Imports and exports: The following table presents...Ch. 4.3 - Energy consumption: The following table presents...Ch. 4.3 - Cost of health care: The following table presents...Ch. 4.3 - Prob. 29ECh. 4.3 - Prob. 30ECh. 4.3 - Prob. 31ECh. 4.3 - Transforming a variable: The following table...Ch. 4.3 - Prob. 33ECh. 4.3 - Prob. 34ECh. 4 - Compute the correlation coefficient for the...Ch. 4 - The number of theaters showing the movie Monsters...Ch. 4 - Use the data in Exercise 2 to compute the...Ch. 4 - A scatterplot has a correlation of r=1. Describe...Ch. 4 - Prob. 5CQCh. 4 - Prob. 6CQCh. 4 - Use the least-squares regression line computed in...Ch. 4 - Use the least-squares regression line computed in...Ch. 4 - Prob. 9CQCh. 4 - A scatterplot has a least-squares regression line...Ch. 4 - Prob. 11CQCh. 4 - Prob. 12CQCh. 4 - A sample of students was studied to determine the...Ch. 4 - In a scatter-plot; the point (-2, 7) is...Ch. 4 - The correlation coefficient for a data set is...Ch. 4 - Prob. 1RECh. 4 - Prob. 2RECh. 4 - Hows your mileage? Weight (in tons) and fuel...Ch. 4 - Prob. 4RECh. 4 - Energy efficiency: A sample of 10 households was...Ch. 4 - Energy efficiency: Using the data in Exercise 5:...Ch. 4 - Prob. 7RECh. 4 - Prob. 8RECh. 4 - Prob. 9RECh. 4 - Prob. 10RECh. 4 - Baby weights: The average gestational age (time...Ch. 4 - Commute times: Every morning, Tania leaves for...Ch. 4 - Prob. 13RECh. 4 - Prob. 14RECh. 4 - Prob. 15RECh. 4 - Describe an example which two variables are...Ch. 4 - Two variables x and y have a positive association...Ch. 4 - Prob. 3WAICh. 4 - Prob. 4WAICh. 4 - Prob. 5WAICh. 4 - Prob. 6WAICh. 4 - Prob. 7WAICh. 4 - Prob. 8WAICh. 4 - Prob. 9WAICh. 4 - The following table, reproduced from the chapter...Ch. 4 - Prob. 2CSCh. 4 - Prob. 3CSCh. 4 - Prob. 4CSCh. 4 - Prob. 5CSCh. 4 - Prob. 6CSCh. 4 - Prob. 7CSCh. 4 - Prob. 8CSCh. 4 - Prob. 9CSCh. 4 - Prob. 10CSCh. 4 - Prob. 11CSCh. 4 - Prob. 12CSCh. 4 - Prob. 13CSCh. 4 - If we are going to use data from this year to...Ch. 4 - Prob. 15CS
Knowledge Booster


Learn more about
Need a deep-dive on the concept behind this application? Look no further. Learn more about this topic, statistics and related others by exploring similar questions and additional content below.Similar questions
- Table 2 shows a recent graduate’s credit card balance each month after graduation. a. Use exponential regression to fit a model to these data. b. If spending continues at this rate, what will the graduate’s credit card debt be one year after graduating?arrow_forwardTable 6 shows the population, in thousands, of harbor seals in the Wadden Sea over the years 1997 to 2012. a. Let x represent time in years starting with x=0 for the year 1997. Let y represent the number of seals in thousands. Use logistic regression to fit a model to these data. b. Use the model to predict the seal population for the year 2020. c. To the nearest whole number, what is the limiting value of this model?arrow_forwardOlympic Pole Vault The graph in Figure 7 indicates that in recent years the winning Olympic men’s pole vault height has fallen below the value predicted by the regression line in Example 2. This might have occurred because when the pole vault was a new event there was much room for improvement in vaulters’ performances, whereas now even the best training can produce only incremental advances. Let’s see whether concentrating on more recent results gives a better predictor of future records. (a) Use the data in Table 2 (page 176) to complete the table of winning pole vault heights shown in the margin. (Note that we are using x=0 to correspond to the year 1972, where this restricted data set begins.) (b) Find the regression line for the data in part ‚(a). (c) Plot the data and the regression line on the same axes. Does the regression line seem to provide a good model for the data? (d) What does the regression line predict as the winning pole vault height for the 2012 Olympics? Compare this predicted value to the actual 2012 winning height of 5.97 m, as described on page 177. Has this new regression line provided a better prediction than the line in Example 2?arrow_forward
- What is the y -intercept on the graph of the logistic model given in the previous exercise?arrow_forwardYou did not really answer my question. You only included dummy variables for MSS. You need to also include dummy variables for BOROUGH and the make the model variables for both MSS and BOROUGH. You were asked to help with analysis of birth weights (BW) of 10,000 infants born in NYC during a certain period of time. The aim of the analysis is to see whether the birth weights of the infants are associated with mothers AGE at birth (continuous variable in years) and mothers smoking status (the maternal smoking status MSS contains 4 categories “Non-smoker”, “Past-smoker”, “Passive-smoker”, “Smoker”) and NYC boroughs (the BOROUGH variable contains 5 categories “Manhattan”, “Bronx”, “Brooklyn”, “Queens” and “Staten Island”). Questions: 1.Write down the population model that estimates BW based on variables AGE and BOROUGH(with the dummy variables). Make sure that it is clear what each predictor means. 2.How many parallel lines are computed by model from population model you created above?…arrow_forwardA virus, due to human error, escaped a research facility in an isolated island. A day after the breach, 7 test subjects were found to be infected. On the sixth day, the count increased to 21 infected. The number increased to 63 infected on the 11th day, 189 on the 16th day, and 567 on the 21st day. If no intervention happened, create a regression model to quantify the infected test subjects after "t" days, graph the function, and, determine the number of infected after 60 days. Use exponential regression model.arrow_forward
- An economist wants to compare the economic growth rate (%) within 50 kilometers and 100 kilometers to cities in a country. He collected 6 cities of the country, and calculated the growth rates with 50km and 100km as shown in the following table. Choose an appropriate test to validate that regions within 100km have higher economic growth rate than the regions within 50km to cities. You can make certain assumptions, but need to write to indicate your assumption. Show calculations by hand.arrow_forwardAn analyst must decide between two different forecasting techniques for weekly sales of roller blades: a linear trend equation and the naive approach. The linear trend equation is F = 124 + 2.1t, and it was developed using data from periods 1 through 10. Based on data for periods 11 through 20 as shown in the table, which of these two methods has the greater accuracy if MAD and MSE are used? (Round your intermediate calculations and final answers to 2 decimal places.) Units Sold 11 144 12 146 13 152 142 15 152 16 149 17 152 18 154 19 157 20 164 Click here for the Excel Data File: MAD (Naive) MAD (Linear) MSE (Naive) MSE (Linear) 4 56 N 00 o oarrow_forwardMonthly sales have been found to follow a linear trend of y = 10 + 8x, where y is the number of items sold and x is the number of the month. Monthly deviations from the trend have been calculated and follow an additive model. In month 12, the seasonal variation is estimated to be -6. What is the forecasted number of items to be sold in month 12?arrow_forward
- What is the mathematical representation for the multiple logistic regression model in photo?arrow_forwardIt contains data on brain mass in different species versus glia-neuron ratio, the latter being a measurement of brain metabolism as the glia provides the metabolic needs of the neurons. The relationship between THE LOGARITHM of the brain mass (in the third column) and Glia-neuron ratio (fourth column) appears linear and it is these two variables that we wish to analyze via linear regression. We would like to know if the human brain fits the trend from the other species. Towards this end we will perform the regression on all species EXCEPT humans (Homo sapiens). Again, throw out the human data from your analysis. You will however need the human numbers for some of the questions. The analysis to be performed is as follows: 1. Calculate the regression line (slope and intercept) 2. Perform an ANOVA test of the null hypothesis for zero slope. From this analysis, obtain SStotal, SSregression and SSresidual as well as the corresponding MS statistics. 3. Perform a t-test of the null…arrow_forwardThe intercept is 0, the autoregressive coefficient is 0.2 and the moving average coefficient is 0.5 in an ARIMA(1,1,1) model. What is the one-step ahead forecast if the shock for the current period is -2 and the current and one-period lagged values of the forecast variable are 110 and 105?arrow_forward
arrow_back_ios
SEE MORE QUESTIONS
arrow_forward_ios
Recommended textbooks for you
 Glencoe Algebra 1, Student Edition, 9780079039897...AlgebraISBN:9780079039897Author:CarterPublisher:McGraw Hill
 Linear Algebra: A Modern IntroductionAlgebraISBN:9781285463247Author:David PoolePublisher:Cengage Learning
 Algebra & Trigonometry with Analytic GeometryAlgebraISBN:9781133382119Author:SwokowskiPublisher:Cengage
 Functions and Change: A Modeling Approach to Coll...AlgebraISBN:9781337111348Author:Bruce Crauder, Benny Evans, Alan NoellPublisher:Cengage Learning
 College AlgebraAlgebraISBN:9781305115545Author:James Stewart, Lothar Redlin, Saleem WatsonPublisher:Cengage Learning
Glencoe Algebra 1, Student Edition, 9780079039897...
Algebra
ISBN:9780079039897
Author:Carter
Publisher:McGraw Hill
Linear Algebra: A Modern Introduction
Algebra
ISBN:9781285463247
Author:David Poole
Publisher:Cengage Learning
Algebra & Trigonometry with Analytic Geometry
Algebra
ISBN:9781133382119
Author:Swokowski
Publisher:Cengage
Functions and Change: A Modeling Approach to Coll...
Algebra
ISBN:9781337111348
Author:Bruce Crauder, Benny Evans, Alan Noell
Publisher:Cengage Learning
College Algebra
Algebra
ISBN:9781305115545
Author:James Stewart, Lothar Redlin, Saleem Watson
Publisher:Cengage Learning
Points, Lines, Planes, Segments, & Rays - Collinear vs Coplanar Points - Geometry; Author: The Organic Chemistry Tutor;https://www.youtube.com/watch?v=dDWjhRfBsKM;License: Standard YouTube License, CC-BY
Naming Points, Lines, and Planes; Author: Florida PASS Program;https://www.youtube.com/watch?v=F-LxiLSSaLg;License: Standard YouTube License, CC-BY