1
To construct: The frequency distribution and histogram for a data of set of 50 comprehension score.
1
Answer to Problem 1TP
| Class-interval | Class Boundaries | Width | Frequency | Cumulative Frequency |
| 2-11 | 1.5-11.5 | 9 | 5 | 5 |
| 12-21 | 11.5-21.5 | 9 | 9 | 14 |
| 22-31 | 21.5-31.5 | 9 | 8 | 22 |
| 32-41 | 31.5-41.5 | 9 | 5 | 27 |
| 42-51 | 41.5-51.5 | 9 | 12 | 39 |
| 52-61 | 51.5-61.5 | 9 | 11 | 50 |
| Total | 50 | 157 |
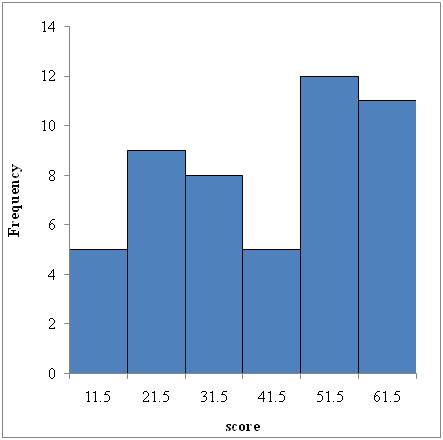
The sketch of histogram is,
Explanation of Solution
Given info:
The data shows the comprehension of 50 scores
| 12 | 22 | 54 | 43 | 56 |
| 15 | 26 | 55 | 31 | 57 |
| 11 | 27 | 51 | 12 | 59 |
| 16 | 36 | 56 | 14 | 54 |
| 21 | 34 | 53 | 15 | 56 |
| 25 | 33 | 57 | 16 | 43 |
| 21 | 38 | 49 | 22 | 44 |
| 8 | 42 | 45 | 29 | 41 |
| 6 | 44 | 45 | 29 | 42 |
| 2 | 47 | 47 | 54 | 7 |
Calculation:
The class boundaries for any class are given by:
Where d is the gap between the upper limit of any class and the lower limit of the succeeding class.
The grouped frequency distribution is as follows:
| Class-interval | Class Boundaries | Frequency |
| 2-11 | 1.5-11.5 | 5 |
| 12-21 | 11.5-21.5 | 9 |
| 22-31 | 21.5-31.5 | 8 |
| 32-41 | 31.5-41.5 | 5 |
| 42-51 | 41.5-51.5 | 12 |
| 52-62 | 51.5-61.5 | 11 |
The histogram is a graph that displays the data by using contiguous vertical bars of various heights to represent the frequencies of the classes.
| Upper Bound | Frequency |
| 11.5 | 5 |
| 21.5 | 9 |
| 31.5 | 8 |
| 41.5 | 5 |
| 51.5 | 12 |
| 61.5 | 11 |
Construction steps for a histogram:
- Press [Ctrl]-N for a new workbook.
- Enter the data in column A, one number per cell.
- Enter the upper boundaries into column B.
- From the toolbar, select the Data tab, then select Data Analysis.
- In Data Analysis, select Histogram and click [OK].
- In the Histogram dialog box, select relative column in the Input
Range box and select upper limit column in the Bin Range box. - Select New Worksheet Ply and Chart Output. Click [OK].
The screen will show the histogram as shown below.
2
To explain: The selection of class interval for frequency distribution table.
2
Answer to Problem 1TP
Explanation of Solution
Step for constructing class intervals
- The largest value is 59 and the smallest value is 2.
- Let the class interval is 7.
- Let the starting point be 1.5.
- Now, the 1st class interval has lower limit 1.5 and upper limit is 11.5 because the class width is 9 and for 2nd class interval the lower limit is the upper limit of 1st class interval after adding class width then get the upper limit of 2nd class interval.
- After adding 7 times the class width in preceding upper limit of class interval to get the 7 class interval that are constructed.
3.
To explain: The skewness of the distribution.
3.
Answer to Problem 1TP
Explanation of Solution
If the most of the data is on the right with few smaller values showing up on the left side of the histogram then data are positively skewed and if most of the data is on the left with few smaller values showing up on the right side of the histogram then data are negatively skewed.
Here the distribution of the 50 score comprehensions on the histogram has more fluctuation from both the side.
Hence, on resulting the data are negatively skewed.
Want to see more full solutions like this?
Chapter 4 Solutions
Statistics for People Who (Think They) Hate Statistics

 MATLAB: An Introduction with ApplicationsStatisticsISBN:9781119256830Author:Amos GilatPublisher:John Wiley & Sons Inc
 Probability and Statistics for Engineering and th...StatisticsISBN:9781305251809Author:Jay L. DevorePublisher:Cengage Learning
 Statistics for The Behavioral Sciences (MindTap C...StatisticsISBN:9781305504912Author:Frederick J Gravetter, Larry B. WallnauPublisher:Cengage Learning
 Elementary Statistics: Picturing the World (7th E...StatisticsISBN:9780134683416Author:Ron Larson, Betsy FarberPublisher:PEARSON
 The Basic Practice of StatisticsStatisticsISBN:9781319042578Author:David S. Moore, William I. Notz, Michael A. FlignerPublisher:W. H. Freeman
 Introduction to the Practice of StatisticsStatisticsISBN:9781319013387Author:David S. Moore, George P. McCabe, Bruce A. CraigPublisher:W. H. Freeman