
The most likely event in a random sample of 100.
To determine: The likelihood of the most likely event.
Answer to Problem 1UA
The most likely event in a random sample of 100 is that 40 people prefer Brand A toothpaste.
The likelihood of the most likely event, “40 people prefer Brand A toothpaste” is 0.0812191.
Explanation of Solution
Given info:
The claim of a manufacturer is that, of all the toothpaste buyers, 40% prefer the toothpaste of Brand A.
Justification:
Define the random variable x as the number of toothpaste buyers who prefer the toothpaste of Brand A, in a random sample of 100.
A close inspection of the graph shows that the probability is the highest when number of persons who prefer Brand A is 40, that is, for
The graph reveals that the value of the probability of the event “40 people prefer Brand A toothpaste” is a 0.081.
Calculation:
Here, the claim of the manufacturer is 40% (or 0.40 proportion) of buyers prefer Brand A and preference of each buyer is independent of the other. The size of the random sample (n) is 100. The probability of success (p) is the probability that a buyer prefers Brand A, which is 0.40. Hence, the random variable follows Binomial distribution.
The binomial probability distribution formula is as follows:
Where, n is the number of trials, x is the number of successes among n trials, p is the probability of success and q is the probability of failure.
Consider n as 100, p as 0.40 and q as
The probability that 40 people prefer Brand A is given below:
Software procedure:
Software procedure for calculating the probability is given below:
- Choose Calc > Probability Distributions > Binomial probability distribution.
- Choose Probability.
- Enter Number of trials as 100 and Event probability as 0.40.
- In Input constant, enter the value 40.
- Click OK.
Output obtained from MINITAB is given below:
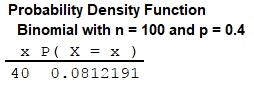
Thus, the probability that 40 people prefer Brand A is 0.0812191.
Conclusion:
From the graph, it can be seen that the event “40 people prefer Brand A toothpaste” has the highest probability, implying that this is the most likely event. On close inspection of the graph, the likelihood of the event appears to be around 0.081.
From the MINITAB output, the probability that 40 people prefer Brand A toothpaste is 0.0812191.
Want to see more full solutions like this?
Chapter 4 Solutions
Elementary Statistics Books a la carte Plus NEW MyLab Statistics with Pearson eText - Access Card Package (6th Edition)

 MATLAB: An Introduction with ApplicationsStatisticsISBN:9781119256830Author:Amos GilatPublisher:John Wiley & Sons Inc
 Probability and Statistics for Engineering and th...StatisticsISBN:9781305251809Author:Jay L. DevorePublisher:Cengage Learning
 Statistics for The Behavioral Sciences (MindTap C...StatisticsISBN:9781305504912Author:Frederick J Gravetter, Larry B. WallnauPublisher:Cengage Learning
 Elementary Statistics: Picturing the World (7th E...StatisticsISBN:9780134683416Author:Ron Larson, Betsy FarberPublisher:PEARSON
 The Basic Practice of StatisticsStatisticsISBN:9781319042578Author:David S. Moore, William I. Notz, Michael A. FlignerPublisher:W. H. Freeman
 Introduction to the Practice of StatisticsStatisticsISBN:9781319013387Author:David S. Moore, George P. McCabe, Bruce A. CraigPublisher:W. H. Freeman