
OPERATIONS MGMT. INSTANT ACCESS
12th Edition
ISBN: 9780134165349
Author: HEIZER
Publisher: PEARSON
expand_more
expand_more
format_list_bulleted
Concept explainers
Videos
Textbook Question
Chapter 4, Problem 30P
Dr. Lillian Fok, a New Orleans psychologist, specializes in treating patients who are agoraphobic (i.e., afraid to leave their homes). The following table indicates how many patients Dr. Fok has seen each year for the past 10 years. It also indicates what the robbery rate was in New Orleans during the same year:
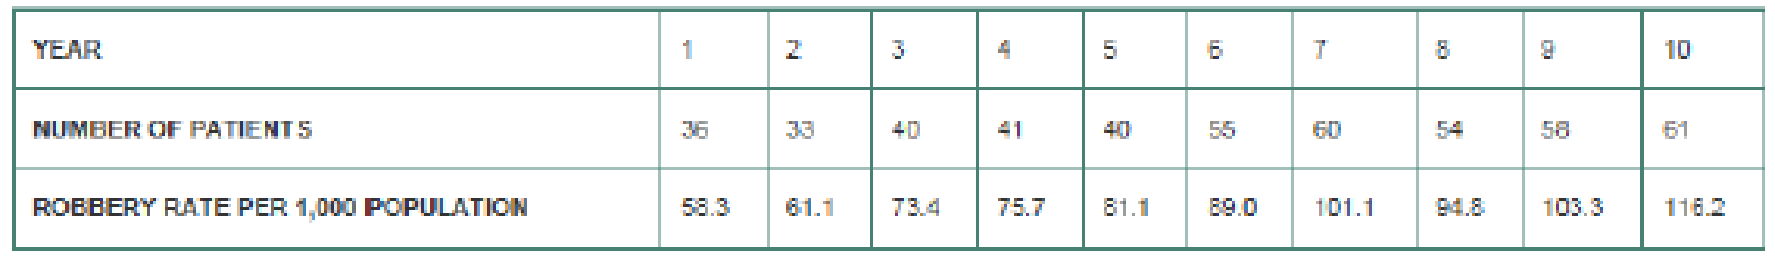
Using trend (linear regression) analysis, predict the number of patients Dr. Fok will see in years 11 and 12 as a function of time. How well does the model fit the data?
Expert Solution & Answer
Want to see the full answer?
Check out a sample textbook solution
Students have asked these similar questions
Dr. Lillian Fok, a New Orleans psychologist, spe-cializes in treating patients who are agoraphobic (i.e., afraid
to leave their homes). The following table indicates how manypatients Dr. Fok has seen each year for the past 10 years. It alsoindicates what the robbery rate was in New Orleans during thesame year:
Using trend (linear regression) analysis, predict the number ofpatients Dr. Fok will see in years 11 and 12 as a function of time.How well does the model fit the data?
The Tech power plant burns coal and natural gas to generate steam and electricity
for all campus buildings. The annual coal consumption at the plant has increased annually for the
past 6 years due to an aggressive campus building program. The following table shows the
annual coal consumption:
Year
Coal Consumption (tons)
1
25000
2
23000
3
28000
4
35000
5
37000
6
42000
Develop a linear trend model to forecast coal consumption for the 7 th year.
Don't answer by pen paper and don't use chatgpt otherwise we will give dounvote
Freight car loadings over a 12-year period at a busy port are as follows:Week Number Week Number Week Number1 220 7 350 13 4602 245 8 360 14 4753 280 9 400 15 5004 275 10 380 16 5105 300 11 420 17 5256 310 12 450 18 541a. Determine a linear trend line for expected freight car loadings.b. Use the trend equation to predict expected loadings for weeks 20 and 21.c. The manager intends to install new equipment when the volume exceeds 800 loadings per week.Assuming the current trend continues, the loading volume will reach that level in approximatelywhat week?
Chapter 4 Solutions
OPERATIONS MGMT. INSTANT ACCESS
Ch. 4 - What is a qualitative foretasting model, and when...Ch. 4 - Identify and briefly describe the two general...Ch. 4 - Identify the three forecasting time horizons....Ch. 4 - Briefly describe the steps that are used to...Ch. 4 - A skeptical manager asks what medium-range...Ch. 4 - Explain why such forecasting devices as moving...Ch. 4 - What is the basic difference between a weighted...Ch. 4 - What three methods are used to determine the...Ch. 4 - Research and briefly describe the Delphi...Ch. 4 - What is the primary difference between a...
Ch. 4 - Define time series.Ch. 4 - What effect does the value of the smoothing...Ch. 4 - Explain the value of seasonal indices in...Ch. 4 - Which forecasting technique can place the most...Ch. 4 - In your own words, explain adaptive forecasting.Ch. 4 - What is the purpose of a tracking signal?Ch. 4 - Explain, in your own words, the meaning of the...Ch. 4 - What is the difference between a dependent and an...Ch. 4 - Give examples of industries that are affected by...Ch. 4 - Give examples of industries in which demand...Ch. 4 - Prob. 21DQCh. 4 - Prob. 22DQCh. 4 - The following gives the number of pints of type B...Ch. 4 - 4.2 a. Plot the above data on a graph. Do you...Ch. 4 - Refer to Problem 4.2. Develop a forecast for years...Ch. 4 - A check-processing center uses exponential...Ch. 4 - The Carbondale Hospital is considering the...Ch. 4 - The monthly sales for Yazici Batteries, Inc., were...Ch. 4 - The actual demand for the patients at Omaha...Ch. 4 - Daily high temperatures in St. Louis for the last...Ch. 4 - Lenovo uses the ZX-81 chip in some of its laptop...Ch. 4 - Data collected on the yearly registrations for a...Ch. 4 - Use exponential smoothing with a smoothing...Ch. 4 - Consider the following actual and forecast demand...Ch. 4 - As you can see in the following table, demand for...Ch. 4 - Following are two weekly forecasts made by two...Ch. 4 - Refer to Solved Problem 4.1 on page 138. a. Use a...Ch. 4 - Solved example 4.1 Sales of Volkswagens popular...Ch. 4 - Refer to Solved Problem 4.1. Using smoothing...Ch. 4 - Consider the following actual (At) and forecast...Ch. 4 - Income at the architectural firm Spraggins and...Ch. 4 - Question 4.20 Resolve Problem 4.19 with =.1 and ...Ch. 4 - Question 4.21 Refer to the trend-adjusted...Ch. 4 - Question 4.22 Refer to Problem 4.21. Complete the...Ch. 4 - Question 4.23 Sales of quilt covers at Bud Baniss...Ch. 4 - Question 4.25 The following gives the number of...Ch. 4 - Prob. 25PCh. 4 - Question 4.27 George Kyparisis owns a company...Ch. 4 - Question 4.28 Attendance at Orlandos newest...Ch. 4 - Question 4.29 North Dakota Electric Company...Ch. 4 - Question 4.33 The number of internal disk drives...Ch. 4 - Dr. Lillian Fok, a New Orleans psychologist,...Ch. 4 - Emergency calls to the 911 system of Durham, North...Ch. 4 - Using the 911 call data in Problem 4.43, forecast...Ch. 4 - Question 4.47 Storrs Cycles has just started...Ch. 4 - Question 4.49 Boulanger Savings and Loan is proud...Ch. 4 - Question 4.24 Mark Gershon, owner of a musical...Ch. 4 - Lori Cook has developed the following forecasting...Ch. 4 - Prob. 45PCh. 4 - Question 4.32 The following data relate the sales...Ch. 4 - Question 4.34 The number of auto accidents in...Ch. 4 - Question 4.35 Rhonda Clark, a Slippery Rock,...Ch. 4 - Accountants at the Tucson firm, Larry Youdelman,...Ch. 4 - Sales of tablet computers at Ted Glickmans...Ch. 4 - Question 4.38 City government has collected the...Ch. 4 - Using the data in Problem 4.39, apply linear...Ch. 4 - Bus and subway ridership for the summer months in...Ch. 4 - Thirteen students entered the business program at...Ch. 4 - Question 4.48 Dave Fletcher, the general manager...Ch. 4 - The following are monthly actual and forecast...Ch. 4 - Prob. 1CSCh. 4 - Prob. 2CSCh. 4 - Prob. 3CSCh. 4 - For its first 2 decades of existence, the NBAs...Ch. 4 - For its first 2 decades of existence, the NBAs...Ch. 4 - For its first 2 decades of existence, the NBAs...Ch. 4 - For its first 2 decades of existence, the NBAs...Ch. 4 - Forecasting at Hard Rock Cafe Video Case With the...Ch. 4 - Forecasting at Hard Rock Cafe Video Case With the...Ch. 4 - Forecasting at Hard Rock Cafe Video Case With the...Ch. 4 - Forecasting at Hard Rock Cafe Video Case With the...Ch. 4 - Forecasting at Hard Rock Cafe Video Case With the...
Knowledge Booster


Learn more about
Need a deep-dive on the concept behind this application? Look no further. Learn more about this topic, operations-management and related others by exploring similar questions and additional content below.Similar questions
- Stock market analysts are continually looking for reliable predictors of stock prices. Consider the problem of modeling the price per share of electric utility stocks (Y). Two variables thought to influence this stock price are return on average equity (X1) and annual dividend rate (X2). The stock price, returns on equity, and dividend rates on a randomly selected day for 16 electric utility stocks are provided in the file P13_15.xlsx. Estimate a multiple regression equation using the given data. Interpret each of the estimated regression coefficients. Also, interpret the standard error of estimate and the R-square value for these data.arrow_forwardSeas Beginning sells clothing by mail order. An important question is when to strike a customer from the companys mailing list. At present, the company strikes a customer from its mailing list if a customer fails to order from six consecutive catalogs. The company wants to know whether striking a customer from its list after a customer fails to order from four consecutive catalogs results in a higher profit per customer. The following data are available: If a customer placed an order the last time she received a catalog, then there is a 20% chance she will order from the next catalog. If a customer last placed an order one catalog ago, there is a 16% chance she will order from the next catalog she receives. If a customer last placed an order two catalogs ago, there is a 12% chance she will order from the next catalog she receives. If a customer last placed an order three catalogs ago, there is an 8% chance she will order from the next catalog she receives. If a customer last placed an order four catalogs ago, there is a 4% chance she will order from the next catalog she receives. If a customer last placed an order five catalogs ago, there is a 2% chance she will order from the next catalog she receives. It costs 2 to send a catalog, and the average profit per order is 30. Assume a customer has just placed an order. To maximize expected profit per customer, would Seas Beginning make more money canceling such a customer after six nonorders or four nonorders?arrow_forwardSuppose that a regional express delivery service company wants to estimate the cost of shipping a package (Y) as a function of cargo type, where cargo type includes the following possibilities: fragile, semifragile, and durable. Costs for 15 randomly chosen packages of approximately the same weight and same distance shipped, but of different cargo types, are provided in the file P13_16.xlsx. a. Estimate a regression equation using the given sample data, and interpret the estimated regression coefficients. b. According to the estimated regression equation, which cargo type is the most costly to ship? Which cargo type is the least costly to ship? c. How well does the estimated equation fit the given sample data? How might the fit be improved? d. Given the estimated regression equation, predict the cost of shipping a package with semifragile cargo.arrow_forward
- The Baker Company wants to develop a budget to predict how overhead costs vary with activity levels. Management is trying to decide whether direct labor hours (DLH) or units produced is the better measure of activity for the firm. Monthly data for the preceding 24 months appear in the file P13_40.xlsx. Use regression analysis to determine which measure, DLH or Units (or both), should be used for the budget. How would the regression equation be used to obtain the budget for the firms overhead costs?arrow_forwardThe management of a technology company is trying to determine the variable that best explains the variation of employee salaries using a sample of 52 full-time employees; see the file P13_08.xlsx. Estimate simple linear regression equations to identify which of the following has the strongest linear relationship with annual salary: the employees gender, age, number of years of relevant work experience prior to employment at the company, number of years of employment at the company, or number of years of post secondary education. Provide support for your conclusion.arrow_forwardThe owner of a restaurant in Bloomington, Indiana, has recorded sales data for the past 19 years. He has also recorded data on potentially relevant variables. The data are listed in the file P13_17.xlsx. a. Estimate a simple regression equation involving annual sales (the dependent variable) and the size of the population residing within 10 miles of the restaurant (the explanatory variable). Interpret R-square for this regression. b. Add another explanatory variableannual advertising expendituresto the regression equation in part a. Estimate and interpret this expanded equation. How does the R-square value for this multiple regression equation compare to that of the simple regression equation estimated in part a? Explain any difference between the two R-square values. How can you use the adjusted R-squares for a comparison of the two equations? c. Add one more explanatory variable to the multiple regression equation estimated in part b. In particular, estimate and interpret the coefficients of a multiple regression equation that includes the previous years advertising expenditure. How does the inclusion of this third explanatory variable affect the R-square, compared to the corresponding values for the equation of part b? Explain any changes in this value. What does the adjusted R-square for the new equation tell you?arrow_forward
- An automobile manufacturer is considering whether to introduce a new model called the Racer. The profitability of the Racer depends on the following factors: The fixed cost of developing the Racer is triangularly distributed with parameters 3, 4, and 5, all in billions. Year 1 sales are normally distributed with mean 200,000 and standard deviation 50,000. Year 2 sales are normally distributed with mean equal to actual year 1 sales and standard deviation 50,000. Year 3 sales are normally distributed with mean equal to actual year 2 sales and standard deviation 50,000. The selling price in year 1 is 25,000. The year 2 selling price will be 1.05[year 1 price + 50 (% diff1)] where % diff1 is the number of percentage points by which actual year 1 sales differ from expected year 1 sales. The 1.05 factor accounts for inflation. For example, if the year 1 sales figure is 180,000, which is 10 percentage points below the expected year 1 sales, then the year 2 price will be 1.05[25,000 + 50( 10)] = 25,725. Similarly, the year 3 price will be 1.05[year 2 price + 50(% diff2)] where % diff2 is the percentage by which actual year 2 sales differ from expected year 2 sales. The variable cost in year 1 is triangularly distributed with parameters 10,000, 12,000, and 15,000, and it is assumed to increase by 5% each year. Your goal is to estimate the NPV of the new car during its first three years. Assume that the company is able to produce exactly as many cars as it can sell. Also, assume that cash flows are discounted at 10%. Simulate 1000 trials to estimate the mean and standard deviation of the NPV for the first three years of sales. Also, determine an interval such that you are 95% certain that the NPV of the Racer during its first three years of operation will be within this interval.arrow_forwardA small computer chip manufacturer wants to forecast monthly ozperating costs as a function of the number of units produced during a month. The company has collected the 16 months of data in the file P13_34.xlsx. a. Determine an equation that can be used to predict monthly production costs from units produced. Are there any outliers? b. How could the regression line obtained in part a be used to determine whether the company was efficient or inefficient during any particular month?arrow_forwardPlay Things is developing a new Lady Gaga doll. The company has made the following assumptions: The doll will sell for a random number of years from 1 to 10. Each of these 10 possibilities is equally likely. At the beginning of year 1, the potential market for the doll is two million. The potential market grows by an average of 4% per year. The company is 95% sure that the growth in the potential market during any year will be between 2.5% and 5.5%. It uses a normal distribution to model this. The company believes its share of the potential market during year 1 will be at worst 30%, most likely 50%, and at best 60%. It uses a triangular distribution to model this. The variable cost of producing a doll during year 1 has a triangular distribution with parameters 15, 17, and 20. The current selling price is 45. Each year, the variable cost of producing the doll will increase by an amount that is triangularly distributed with parameters 2.5%, 3%, and 3.5%. You can assume that once this change is generated, it will be the same for each year. You can also assume that the company will change its selling price by the same percentage each year. The fixed cost of developing the doll (which is incurred right away, at time 0) has a triangular distribution with parameters 5 million, 7.5 million, and 12 million. Right now there is one competitor in the market. During each year that begins with four or fewer competitors, there is a 25% chance that a new competitor will enter the market. Year t sales (for t 1) are determined as follows. Suppose that at the end of year t 1, n competitors are present (including Play Things). Then during year t, a fraction 0.9 0.1n of the company's loyal customers (last year's purchasers) will buy a doll from Play Things this year, and a fraction 0.2 0.04n of customers currently in the market ho did not purchase a doll last year will purchase a doll from Play Things this year. Adding these two provides the mean sales for this year. Then the actual sales this year is normally distributed with this mean and standard deviation equal to 7.5% of the mean. a. Use @RISK to estimate the expected NPV of this project. b. Use the percentiles in @ RISKs output to find an interval such that you are 95% certain that the companys actual NPV will be within this interval.arrow_forward
- Freight car loadings over an 18-week period at a busy port are as follows: Week Number Week Number Week Number 1 410 7 460 13 540 2 420 8 480 14 550 3 430 9 500 15 570 4 420 10 490 16 580 5 430 11 510 17 590 6 440 12 530 18 600 Click here for the Excel Data File a. Determine a linear trend line for expected freight car loadings. (Round your intermediate calculations and final answers to 2 decimal places.) b. Use the above trend equation to predict expected loadings for Weeks 20 & 21. (Round your final answers to 2 decimal places.) c. The manager intends to install new equipment when the volume exceeds 990 loadings per week. Assuming the current trend continues, in which week (at the earliest) should the loading volume reach that level? (Use the rounded answers, as required, from any previous part of this problem. Do not round any other intermediate calculations. Round your final answer to 2 decimal places.)arrow_forward5-21 A college student has just completed her junior year. The following table summarizes her grade-point average (GPA) for each of the past nine quarters: Year Semester GPA Freshman Fall 2.4 Winter 2.9 Spring 3.1 Sophomore Fall 3.2 Winter 3.0 Spring 2.9 Junior Fall 2.8 Winter 3.6 Spring 3.2 Forecast the student’s GPA for the fall semester of her senior year by using a three-period moving average. Forecast the student’s GPA for the fall semester of her senior year by using exponential smoothing with α=0.2 . Which of the two methods provides a more accurate forecast? Justify your answer.arrow_forwardFreight car loadings over an 18-week period at a busy port are as follows:Weeks Loadings (lbs) Weeks Loadings (lbs) Weeks Loadings (lbs) 1 370 7 415 13 450 2 380 8 425 14 455 3 390 9 435 15 475 4 380 10 425 16 485 5 390 11 435 17 495 6 395 12 445 18 505a. Determine a linear trend line for expected freight car loadings.b. Use the above trend equation to predict expected loadings for Weeks 20 & 21.c. The manager intends to install new equipment when the volume exceeds 950 loadings per week. Assuming the current trend continues, in which week…arrow_forward
arrow_back_ios
SEE MORE QUESTIONS
arrow_forward_ios
Recommended textbooks for you
 Practical Management ScienceOperations ManagementISBN:9781337406659Author:WINSTON, Wayne L.Publisher:Cengage,
Practical Management Science
Operations Management
ISBN:9781337406659
Author:WINSTON, Wayne L.
Publisher:Cengage,
Single Exponential Smoothing & Weighted Moving Average Time Series Forecasting; Author: Matt Macarty;https://www.youtube.com/watch?v=IjETktmL4Kg;License: Standard YouTube License, CC-BY
Introduction to Forecasting - with Examples; Author: Dr. Bharatendra Rai;https://www.youtube.com/watch?v=98K7AG32qv8;License: Standard Youtube License