
Concept explainers
Videos
To find whether the graph below shows a positive, a negative, or no
Answer to Problem 38SGR
Weak
Explanation of Solution
Given information:The graph is shown below.
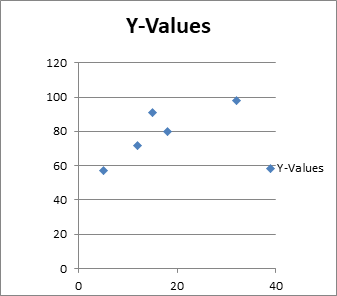
Where x- axis shows Hours Spend Studing and y -axis shows Test Scores.
Calculation:
In general, the test scores increase as the amount of time spent studying increases. The regression line for this datahas a positive slope and a correlation coefficient close to 0.5. Since 0.5 is not close to 1, the equation is not a good fitof the data. So, the graph shows a weak positive correlation. This means the more study, the better testscore is likely to be.
Chapter 4 Solutions
Glencoe Algebra 1, Student Edition, 9780079039897, 0079039898, 2018
Additional Math Textbook Solutions
Graphical Approach To College Algebra
Differential Equations and Linear Algebra (4th Edition)
College Algebra
College Algebra
College Algebra with Modeling & Visualization (5th Edition)
Linear Algebra and Its Applications (5th Edition)


 Algebra and Trigonometry (6th Edition)AlgebraISBN:9780134463216Author:Robert F. BlitzerPublisher:PEARSON
 Contemporary Abstract AlgebraAlgebraISBN:9781305657960Author:Joseph GallianPublisher:Cengage Learning
 Linear Algebra: A Modern IntroductionAlgebraISBN:9781285463247Author:David PoolePublisher:Cengage Learning
 Algebra And Trigonometry (11th Edition)AlgebraISBN:9780135163078Author:Michael SullivanPublisher:PEARSON
 Introduction to Linear Algebra, Fifth EditionAlgebraISBN:9780980232776Author:Gilbert StrangPublisher:Wellesley-Cambridge Press
 College Algebra (Collegiate Math)AlgebraISBN:9780077836344Author:Julie Miller, Donna GerkenPublisher:McGraw-Hill Education