(a)
Interpretation:
Whether the concentration
(a)
Explanation of Solution
Given data:
The sediments in North Sea which are traces of toxic, man-made hexachlorohexanes were extracted by two new procedures and by a known process.
The concentration of sediments measured by chromatography are given in the below Figure 1.
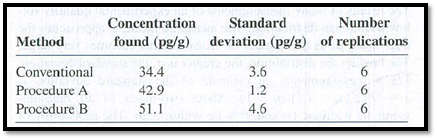
Figure 1
Expansion of
The given concentration
The concentration
(b)
Interpretation:
Whether the standard deviations of procedure B and conventional procedure differ significantly has to be given.
Concept Introduction:
Comparison of Standard Deviation with F Test:
For the comparison of mean values of two sets of measurements, we decide whether the standard deviations of the two sets are “statistically different”. This is done by F test.
The F test with quotient F is given as:
Where,
If
Degrees of Freedom:
For a n set of measurement, the degrees of freedom will be
To Give: Whether the standard deviations of procedure B and conventional procedure differ significantly.
(b)
Answer to Problem 4.GE
The standard deviation of procedure B and conventional procedure are not significantly different.
Explanation of Solution
Given data:
The sediments in North Sea which are traces of toxic, man-made hexachlorohexanes were extracted by two new procedures and by a known process.
The concentration of sediments measured by chromatography are given in the below Figure 1.
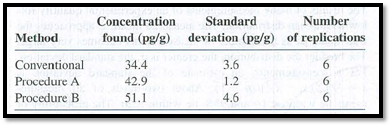
Figure 1
Comparison of Standard deviation:
From the given data, let us assume
The standard deviation for procedure B as
The standard deviation for conventional procedure as
The number of measurements for procedure B as
The number of measurements for conventional procedure as
The significance in standard deviation is found using F test.
The
Hence, standard deviations are not significantly different at
The standard deviation of procedure B and conventional procedure are found to be not significantly different.
(c)
Interpretation:
Whether the mean concentration of procedure B and conventional procedure differ significantly has to be given.
Concept Introduction:
Comparing replicate measurements:
When the two standard deviations are not significantly different from each other, the equation used is:
To Give: Whether the mean concentration of procedure B and conventional procedure differ significantly
(c)
Answer to Problem 4.GE
The standard deviation of procedure B and conventional procedure are not significantly different.
Explanation of Solution
Given data:
The sediments in North Sea which are traces of toxic, man-made hexachlorohexanes were extracted by two new procedures and by a known process.
The concentration of sediments measured by chromatography are given in the below Figure 1.
Figure 1
Comparison of Standard deviation:
From the given data, let us assume
The standard deviation for procedure B as
The standard deviation for conventional procedure as
The number of measurements for procedure B as
The number of measurements for conventional procedure as
The result of F- test from part (b) indicates that the standard deviations are not significant.
Hence, the equation used to compare mean is as follows,
Calculate
The
The
Thus,
Therefore, the difference in mean concentrations are significant at the
The mean concentration of procedure B and conventional procedure are found to be significantly different.
(d)
Interpretation:
Whether the standard deviation and mean concentration of procedure A and conventional procedure differ significantly has to be given.
Concept Introduction:
Comparison of Standard Deviation with F Test:
For the comparison of mean values of two sets of measurements, we decide whether the standard deviations of the two sets are “statistically different”. This is done by F test.
The F test with quotient F is given as:
Where,
If
Degrees of Freedom:
For a n set of measurement, the degrees of freedom will be
When the standard deviations of two sets of measurements are significantly different, the equations used are:
To Give: Whether the standard deviation and mean concentration of procedure A and conventional procedure differ significantly
(d)
Answer to Problem 4.GE
The standard deviation of procedure A and conventional procedure are significantly different from each other.
The mean concentration of procedure A and conventional procedure are significantly different from each other at the
Explanation of Solution
Given data:
The sediments in North Sea which are traces of toxic, man-made hexachlorohexanes were extracted by two new procedures and by a known process.
The concentration of sediments measured by chromatography are given in the below Figure 1.
Figure 1
Comparison of Standard deviation:
From the given data, let us assume
The standard deviation for conventional procedure as
The standard deviation for procedure A as
The number of measurements for conventional procedure as
The number of measurements for procedure A as
The significance in standard deviation is found using F test.
The
Hence, standard deviations are significantly different at
The result of F- test indicates that the difference in standard deviations are significant.
Hence, the equation used to compare mean is as follows,
Calculate degrees of freedom as below:
The
The
Thus,
Therefore, the difference in mean concentrations are significant at the
The standard deviation of procedure A and conventional procedure are found out as significantly different from each other.
The mean concentration of procedure A and conventional procedure are found out as significantly different from each other at the
Want to see more full solutions like this?
Chapter 4 Solutions
Quantitative Chemical Analysis 9e & Sapling E-Book and Homework for Quantitative Chemical Analysis (Six Month Access) 9e

 ChemistryChemistryISBN:9781305957404Author:Steven S. Zumdahl, Susan A. Zumdahl, Donald J. DeCostePublisher:Cengage Learning
 ChemistryChemistryISBN:9781259911156Author:Raymond Chang Dr., Jason Overby ProfessorPublisher:McGraw-Hill Education
 Principles of Instrumental AnalysisChemistryISBN:9781305577213Author:Douglas A. Skoog, F. James Holler, Stanley R. CrouchPublisher:Cengage Learning
 Organic ChemistryChemistryISBN:9780078021558Author:Janice Gorzynski Smith Dr.Publisher:McGraw-Hill Education
 Chemistry: Principles and ReactionsChemistryISBN:9781305079373Author:William L. Masterton, Cecile N. HurleyPublisher:Cengage Learning
 Elementary Principles of Chemical Processes, Bind...ChemistryISBN:9781118431221Author:Richard M. Felder, Ronald W. Rousseau, Lisa G. BullardPublisher:WILEY