Essentials Of Statistics For Business & Economics
9th Edition
ISBN: 9780357045435
Author: David R. Anderson, Dennis J. Sweeney, Thomas A. Williams, Jeffrey D. Camm, James J. Cochran
Publisher: South-Western College Pub
expand_more
expand_more
format_list_bulleted
Concept explainers
Textbook Question
Chapter 4, Problem 52SE
An MBA new-matriculants survey provided the following data for 2018 students.
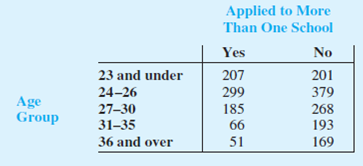
- a. For a randomly selected MBA student, prepare a joint
probability table for the experiment consisting of observing the student’s age and whether the student applied to one or more schools. - b. What is the probability that a randomly selected applicant is 23 or under?
- c. What is the probability that a randomly selected applicant is older than 26?
- d. What is the probability that a randomly selected applicant applied to more than one school?
Expert Solution & Answer

Want to see the full answer?
Check out a sample textbook solution
Students have asked these similar questions
In a study on speed control, it was found that the main reasons for regulations were to make traffic flow efficient and to minimize the risk of danger. An area that was focused on in the study was the distance required to completely stop a vehicle at various speeds. Use the following table to answer the questions.
MPH
Braking distance (yrds)
5
10
10
17
20
27
30
50
40
60
50
100
60
150
70
200
a. Suppose the correlation coefficient (r) is 0.956? Does this suggest a strong relationship? Explain
b. What would you conclude about the relationship if r=0? Discuss
c. Explain what Does correlation mean causation?
D. Is there a relationship between the two variables? And if so, is it positive or negative? Why?
In a study on speed control, it was found that the main reasons for regulations were to make traffic flow efficient and to minimize the risk of danger. An area that was focused on in the study was the distance required to completely stop a vehicle at various speeds. Use the following table to answer the questions.
MPH
Braking distance (yrds)
5
10
10
17
20
27
30
50
40
60
50
100
60
150
70
200
Business
Chapter 4 Solutions
Essentials Of Statistics For Business & Economics
Ch. 4.1 - 1. An experiment has three steps with three...Ch. 4.1 - 2. How many ways can three items be selected from...Ch. 4.1 - How many permutations of three items can be...Ch. 4.1 - 4. Consider the experiment of tossing a coin three...Ch. 4.1 - 5. Suppose an experiment has five equally likely...Ch. 4.1 - An experiment with three outcomes has been...Ch. 4.1 - A decision maker subjectively assigned the...Ch. 4.1 - In the city of Milford, applications for zoning...Ch. 4.1 - Simple random sampling uses a sample of size n...Ch. 4.1 - Code Churn. Code Churn is a common metric used to...
Ch. 4.1 - Tri-State Smokers. A Gallup Poll of U.S. adults...Ch. 4.1 - A company that manufactures toothpaste is studying...Ch. 4.1 - Powerball Lottery. The Powerball lottery is played...Ch. 4.2 - An experiment has four equally likely outcomes:...Ch. 4.2 - 15. Consider the experiment of selecting a playing...Ch. 4.2 - Consider the experiment of rolling a pair of dice....Ch. 4.2 - Refer to the KPL sample points and sample point...Ch. 4.2 - 18. Fortune magazine publishes an annual list of...Ch. 4.2 - 19. Do you think global warming will have an...Ch. 4.2 - Junior Achievement USA and the Allstate Foundation...Ch. 4.2 - Fatal Collisions with a Fixed Object. The National...Ch. 4.3 - Suppose that we have a sample space with five...Ch. 4.3 - 23. Suppose that we have a sample space S = {E1,...Ch. 4.3 - Clarkson University surveyed alumni to learn more...Ch. 4.3 - Americans Using Facebook and LinkedIn. A 2018 Pew...Ch. 4.3 - 26. Information about mutual funds provided by...Ch. 4.3 - Social Media Use. A marketing firm would like to...Ch. 4.3 - A survey of magazine subscribers showed that 45.8%...Ch. 4.3 - High school seniors with strong academic records...Ch. 4.4 - 30. Suppose that we have two events, A and B, with...Ch. 4.4 - 31. Assume that we have two events, A and B, that...Ch. 4.4 - Living with Family. Consider the following example...Ch. 4.4 - 33. Students taking the Graduate Management...Ch. 4.4 - The bureau of Transportation Statistics reports...Ch. 4.4 - 35. To better understand how husbands and wives...Ch. 4.4 - Jamal Crawford of the National Basketball...Ch. 4.4 - Giving Up Electronics. A 2018 Pew Research Center...Ch. 4.4 - The Institute for Higher Education Policy, a...Ch. 4.5 - The prior probabilities for events A1 and A2 are...Ch. 4.5 - 40. The prior probabilities for events A1, A2, and...Ch. 4.5 - 41. A consulting firm submitted a bid for a large...Ch. 4.5 - A local bank reviewed its credit card policy with...Ch. 4.5 - Prostate Cancer Screening. According to a 2018...Ch. 4.5 - ParFore created a website to market golf equipment...Ch. 4.5 - Americans Without Health Insurance. The National...Ch. 4 - A survey of adults aged 18 and older conducted by...Ch. 4 - 47. A financial manager made two new...Ch. 4 - 48. Forty-three percent of Americans use social...Ch. 4 - A study of 31,000 hospital admissions in New York...Ch. 4 - 50. A telephone survey to determine viewer...Ch. 4 - The U.S. Census Bureau serves as the leading...Ch. 4 - An MBA new-matriculants survey provided the...Ch. 4 - 53. Refer again to the data from the MBA...Ch. 4 - 54. In February 2012, the Pew Internet & American...Ch. 4 - 55. A large consumer goods company ran a...Ch. 4 - 56. Cooper Realty is a small real estate company...Ch. 4 - A company studied the number of lost-time...Ch. 4 - According to the Open Doors Report, 9.5% of all...Ch. 4 - An oil company purchased an option on land in...Ch. 4 - The five most common words appearing in spam...Ch. 4 - Robs Market (RM) is a regional food store chain in...
Knowledge Booster
Learn more about
Need a deep-dive on the concept behind this application? Look no further. Learn more about this topic, statistics and related others by exploring similar questions and additional content below.Similar questions
- 3. Bayesian Inference – Updating Beliefs A medical test for a rare disease has the following characteristics: Sensitivity (true positive rate): 99% Specificity (true negative rate): 98% The disease occurs in 0.5% of the population. A patient receives a positive test result. Questions: a) Define the relevant events and use Bayes’ Theorem to compute the probability that the patient actually has the disease.b) Explain why the result might seem counterintuitive, despite the high sensitivity and specificity.c) Discuss how prior probabilities influence posterior beliefs in Bayesian inference.d) Suppose a second, independent test with the same accuracy is conducted and is also positive. Update the probability that the patient has the disease.arrow_forward4. Linear Regression - Model Assumptions and Interpretation A real estate analyst is studying how house prices (Y) are related to house size in square feet (X). A simple linear regression model is proposed: The analyst fits the model and obtains: • Ŷ50,000+150X YBoB₁X + € • R² = 0.76 • Residuals show a fan-shaped pattern when plotted against fitted values. Questions: a) Interpret the slope coefficient in context. b) Explain what the R² value tells us about the model's performance. c) Based on the residual pattern, what regression assumption is likely violated? What might be the consequence? d) Suggest at least two remedies to improve the model, based on the residual analysis.arrow_forward5. Probability Distributions – Continuous Random Variables A factory machine produces metal rods whose lengths (in cm) follow a continuous uniform distribution on the interval [98, 102]. Questions: a) Define the probability density function (PDF) of the rod length.b) Calculate the probability that a randomly selected rod is shorter than 99 cm.c) Determine the expected value and variance of rod lengths.d) If a sample of 25 rods is selected, what is the probability that their average length is between 99.5 cm and 100.5 cm? Justify your answer using the appropriate distribution.arrow_forward
- 2. Hypothesis Testing - Two Sample Means A nutritionist is investigating the effect of two different diet programs, A and B, on weight loss. Two independent samples of adults were randomly assigned to each diet for 12 weeks. The weight losses (in kg) are normally distributed. Sample A: n = 35, 4.8, s = 1.2 Sample B: n=40, 4.3, 8 = 1.0 Questions: a) State the null and alternative hypotheses to test whether there is a significant difference in mean weight loss between the two diet programs. b) Perform a hypothesis test at the 5% significance level and interpret the result. c) Compute a 95% confidence interval for the difference in means and interpret it. d) Discuss assumptions of this test and explain how violations of these assumptions could impact the results.arrow_forward1. Sampling Distribution and the Central Limit Theorem A company produces batteries with a mean lifetime of 300 hours and a standard deviation of 50 hours. The lifetimes are not normally distributed—they are right-skewed due to some batteries lasting unusually long. Suppose a quality control analyst selects a random sample of 64 batteries from a large production batch. Questions: a) Explain whether the distribution of sample means will be approximately normal. Justify your answer using the Central Limit Theorem. b) Compute the mean and standard deviation of the sampling distribution of the sample mean. c) What is the probability that the sample mean lifetime of the 64 batteries exceeds 310 hours? d) Discuss how the sample size affects the shape and variability of the sampling distribution.arrow_forwardA biologist is investigating the effect of potential plant hormones by treating 20 stem segments. At the end of the observation period he computes the following length averages: Compound X = 1.18 Compound Y = 1.17 Based on these mean values he concludes that there are no treatment differences. 1) Are you satisfied with his conclusion? Why or why not? 2) If he asked you for help in analyzing these data, what statistical method would you suggest that he use to come to a meaningful conclusion about his data and why? 3) Are there any other questions you would ask him regarding his experiment, data collection, and analysis methods?arrow_forward
- Businessarrow_forwardWhat is the solution and answer to question?arrow_forwardTo: [Boss's Name] From: Nathaniel D Sain Date: 4/5/2025 Subject: Decision Analysis for Business Scenario Introduction to the Business Scenario Our delivery services business has been experiencing steady growth, leading to an increased demand for faster and more efficient deliveries. To meet this demand, we must decide on the best strategy to expand our fleet. The three possible alternatives under consideration are purchasing new delivery vehicles, leasing vehicles, or partnering with third-party drivers. The decision must account for various external factors, including fuel price fluctuations, demand stability, and competition growth, which we categorize as the states of nature. Each alternative presents unique advantages and challenges, and our goal is to select the most viable option using a structured decision-making approach. Alternatives and States of Nature The three alternatives for fleet expansion were chosen based on their cost implications, operational efficiency, and…arrow_forward
arrow_back_ios
SEE MORE QUESTIONS
arrow_forward_ios
Recommended textbooks for you
- Holt Mcdougal Larson Pre-algebra: Student Edition...AlgebraISBN:9780547587776Author:HOLT MCDOUGALPublisher:HOLT MCDOUGALCollege Algebra (MindTap Course List)AlgebraISBN:9781305652231Author:R. David Gustafson, Jeff HughesPublisher:Cengage Learning

Holt Mcdougal Larson Pre-algebra: Student Edition...
Algebra
ISBN:9780547587776
Author:HOLT MCDOUGAL
Publisher:HOLT MCDOUGAL

College Algebra (MindTap Course List)
Algebra
ISBN:9781305652231
Author:R. David Gustafson, Jeff Hughes
Publisher:Cengage Learning

Mod-01 Lec-01 Discrete probability distributions (Part 1); Author: nptelhrd;https://www.youtube.com/watch?v=6x1pL9Yov1k;License: Standard YouTube License, CC-BY
Discrete Probability Distributions; Author: Learn Something;https://www.youtube.com/watch?v=m9U4UelWLFs;License: Standard YouTube License, CC-BY
Probability Distribution Functions (PMF, PDF, CDF); Author: zedstatistics;https://www.youtube.com/watch?v=YXLVjCKVP7U;License: Standard YouTube License, CC-BY
Discrete Distributions: Binomial, Poisson and Hypergeometric | Statistics for Data Science; Author: Dr. Bharatendra Rai;https://www.youtube.com/watch?v=lHhyy4JMigg;License: Standard Youtube License