
Videos
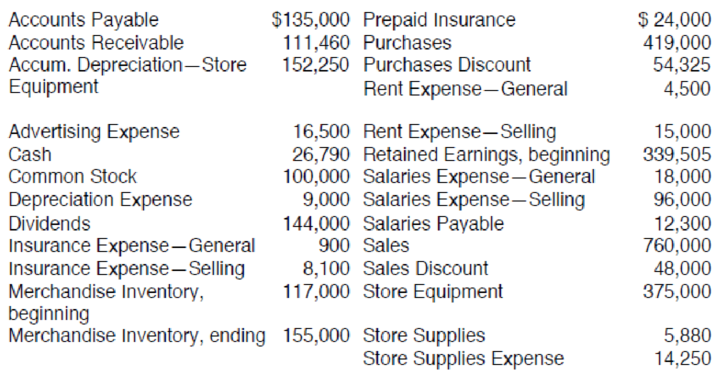
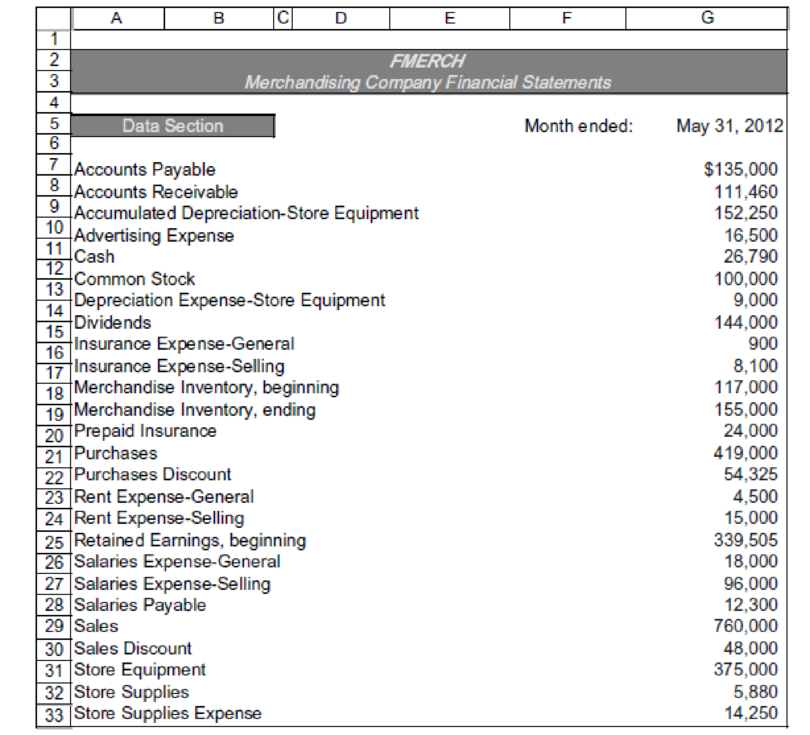
The following information is for Bonnieʼs Buds, a nursery and floral shop, for the month ended May 31, 2012:
Click the Chart sheet tab on the FMERCH3 file. You will see a chart depicting the five-month trend in sales, gross profit, and net income. What favorable and unfavorable trends do you see in this month-to-month comparison? Comment on any unusual changes. When the assignment is complete, close the file without saving it again.
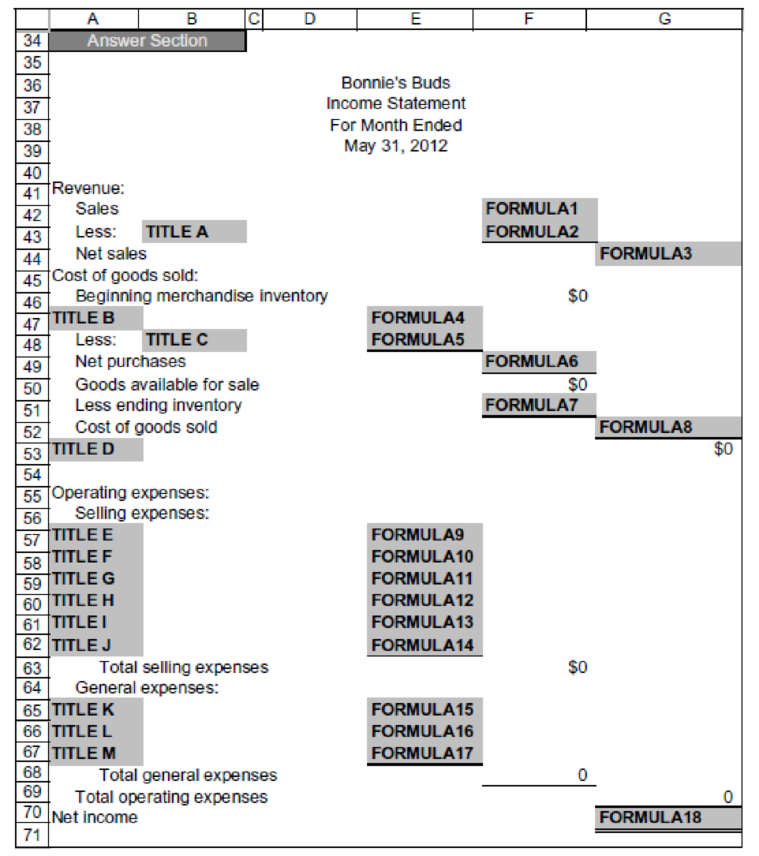
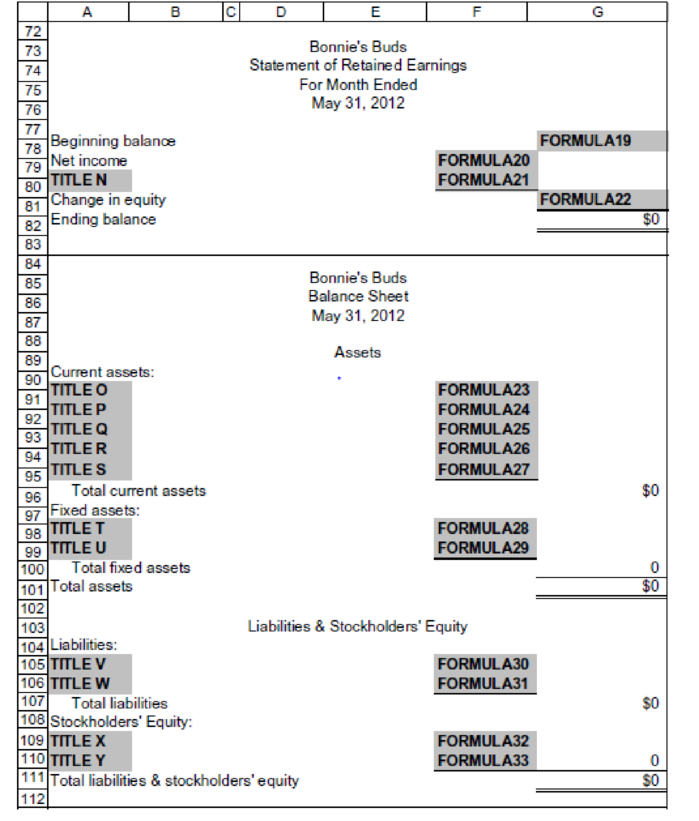
Worksheet. Your boss would prefer to have the
Chart. Using the FMERCH3 file, prepare a 3-D pie chart that shows the amount of each of the selling expenses in June. No Chart Data Table is needed. Select A57 to A62 as one range on the worksheet to be charted and then hold down the CTRL key and select E57 to E62 as the second range. Enter your name somewhere on the chart. Save the file again as FMERCH3. Select the chart and then print it out.
Want to see the full answer?
Check out a sample textbook solution
Chapter 4 Solutions
Excel Applications for Accounting Principles


- The following information is from Dessert Dynasty. The company runs three stores and the December Income Statement for all stores is shown. A. Find the missing values for retail revenue, ingredients, and operating income. B. Comment on the financial performance of each store. C. Identify a limitation of analyzing the information provided. You may want to consider using Microsoft Excel or another spreadsheet application for the numerical data. This information will be used in a subsequent question.arrow_forwardBay Book and Software has two sales departments: Book and Software. After recording and posting all adjustments, including the adjustments for merchandise inventory, the accountant prepared the adjusted trial balance (shown on the next page) at the end of the fiscal year. Merchandise inventories at the beginning of the year were as follows: Book Department, 53,410; Software Department, 23,839. The bases (and sources of figures) for apportioning expenses to the two departments are as follows (rounded to the nearest dollar): Sales Salary Expense (payroll register): Book Department, 45,559; Software Department, 35,629 Advertising Expense (newspaper column inches): Book Department, 550 inches; Software Department, 450 inches Depreciation Expense, Store Equipment (property and equipment ledger): Book Department, 7,851; Software Department, 2,682 Store Supplies Expense (requisitions): Book Department, 205; Software Department, 199 Miscellaneous Selling Expense (volume of gross sales): Book Department, 240; Software Department, 110 Rent Expense and Utilities Expense (floor space): Book Department, 9,000 square feet; Software Department, 7,000 square feet Bad Debts Expense (volume of gross sales): Book Department, 1,029; Software Department, 441 Miscellaneous General Expense (volume of gross sales): Book Department, 364; Software Department, 156 Required Prepare an income statement by department to show income from operations, as well as a nondepartmentalized income statement (using the Total columns) to show net income for the entire company.arrow_forwardThe following table provides monthly revenue values for Tedstar, Inc., a company that sells valves to large industrial firms. The monthly revenue data have been graphed using a line chart in the following figure. a. What are the problems with the layout and display of this line chart? b. Create a new line chart for the monthly revenue data at Tedstar, Inc. Format the chart to make it easy to read and interpret.arrow_forward
- On September 30, 2013, the general ledger of Leons Golf Shop, which uses the calendar year as its accounting period, showed the following year-to-date account balances: The merchandise inventory account had a 48,000 balance on January 1, 2013. The historical gross profit percentage is 40%. Leon prepares quarterly financial statements and takes physical inventory once a yearat the end of the accounting period. In order to prepare the financial statements for the third quarter, the store needs to have an estimate of ending inventory. You have been asked to use the gross profit method to estimate the ending inventory. Review the worksheet called GP. Study it carefully because it may have a solution format somewhat different from the one shown in your textbook.arrow_forwardThe following table shows monthly revenue for six different web development companies. a. Use Excel to create sparklines for sales at each company. b. Which companies have generally decreasing revenues over the six months? Which company has exhibited the most consistent growth over the six months? Which companies have revenues that are both increasing and decreasing over the six months? c. Use Excel to create a heat map for the revenue of the six companies. Do you find the heat map or the sparklines to be better at communicating the trend of revenues over the six months for each company? Why?arrow_forwardThe following is the adjusted trial balance data for Ninos Pizzeria as of December 31, 2019. A. Use the data provided to compute net sales for 2019. B. Compute the gross margin for 2019. C. Compute the gross profit margin ratio (rounded to nearest hundredth). D. Prepare a simple income statement for the year ended December 31, 2019. E. Prepare a multi-step income statement for the year ended December 31, 2019.arrow_forward
- The following information is from Tejas WindowTint’s financial records. Month Sales PurchasesApril ........................... $72,000 ............................................................ $42,000May ............................. 66,000 ............................................................ 48,000June ............................ 60,000 ............................................................ 36,000July .............................. 78,000 ............................................................ 54,000 Collections from customers are normally 70 percent in the month of sale, 20 percent in the month following the sale, and 9 percent in the second month following the sale. The balance is expected to be uncollectible. All purchases are on account. Management takes full advantage of the 2 percent discount allowed on purchases paid for by the tenth of the following month. Purchases for August are…arrow_forwardThe following is the adjusted trial balance data for Nino’s Pizzeria as of December 31, 2019. Use the data provided to compute net sales for 2019. Compute the gross margin for 2019. Compute the gross profit margin ratio (rounded to nearest hundredth). Prepare a simple income statement for the year ended December 31, 2019. Prepare a multi-step income statement for the year ended December 31, 2019.arrow_forwardKimberly’s boards sells a snowboard, Xpert, that has popular snowboard enthusiasts. Information relating to Kymberly’s purchases of Xpert snowboards doing September is shown below. During the same month, 124 Xpert words were sold. Kymberly's uses a periodic inventory system. For both FIFO and LIFO, calculate the sum of ending inventory and cost of goods sold.arrow_forward
- Blossom Company provides the following information for the month ended October 31, 2022: sales on credit $280,100, cash sales $100,100, sales discounts $5,100, and sales returns and allowances $10,100.Prepare the sales section of the income statement based on this information. BLOSSOM COMPANYIncome Statement (Partial)choose the accounting period For the Year Ended October 31, 2022For the Month Ended October 31, 2022October 31, 2022 select an opening section name DrawingsExpensesNet Income / (Loss)SalesTotal ExpensesTotal RevenuesNet SalesOwner's Capital, October 1Owner's Capital, October 31Cost of Goods SoldGross Profit select an item $enter a dollar amount select between addition and deduction AddLess: select an item $enter a dollar amount select an…arrow_forwardThe Income Statement columns of the August 31 (year-end) work sheet for Ralley Company are shown here. To save time and space, the expenses have been grouped together into two categories. INCOME STATEMENT ACCOUNT NAME DEBIT CREDIT Income Summary 31,100.00 31,130.00 Sales 324,360.00 Sales Returns and Allowances 13,970.00 Sales Discounts 7,620.00 Purchases 126,210.00 Purchases Returns and Allowances 1,020.00 Purchases Discounts 1,110.00 Freight In 8,460.00 Selling Expenses 61,470.00 General Expenses 51,751.00 300,581.00 357,620.00 Net Income 57,039.00 357,620.00 357,620.00 From the information given, prepare an income statement for the company. Ralley CompanyIncome StatementFor Year Ended August 31, 20-- (See images)arrow_forwardThe adjusted trial balance of Splish Company shows the following data pertaining to sales at the end of its fiscal year, October 31, 2020: Sales Revenue $819,500, Delivery Expense $12,610, Sales Returns and Allowances $25,880, and Sales Discounts $11,450. (a) Prepare the revenues section of the income statement. SPLISH COMPANYIncome Statement $ : $ $ Save for Laterarrow_forward
 Excel Applications for Accounting PrinciplesAccountingISBN:9781111581565Author:Gaylord N. SmithPublisher:Cengage Learning
 Principles of Accounting Volume 2AccountingISBN:9781947172609Author:OpenStaxPublisher:OpenStax College
 Essentials of Business Analytics (MindTap Course ...StatisticsISBN:9781305627734Author:Jeffrey D. Camm, James J. Cochran, Michael J. Fry, Jeffrey W. Ohlmann, David R. AndersonPublisher:Cengage Learning
 College Accounting (Book Only): A Career ApproachAccountingISBN:9781337280570Author:Scott, Cathy J.Publisher:South-Western College PubPrinciples of Accounting Volume 1AccountingISBN:9781947172685Author:OpenStaxPublisher:OpenStax College