
Concept explainers
Videos
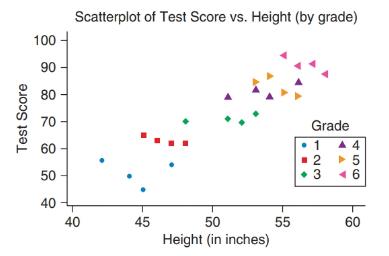
Heights and Test Scores
a. The following figure shows hypothetical data for a group of children. By looking at the figure, state whether the
b. The shape and color of the each marker show what grade these children were in at the time they took the test. Look at the six different groupings (for grades 1, 2, 3, 4, 5, and 6) and decide whether the correlation (the answer to part [a]) would stay the same if you controlled for grade (that is, if you looked only within specific grades).
c. Suppose a school principal looked at this
Want to see the full answer?
Check out a sample textbook solution
Chapter 4 Solutions
EP INTRODUCTORY STATISTICS-MYSTATLAB
Additional Math Textbook Solutions
Business Analytics
Statistical Techniques in Business and Economics
An Introduction to Mathematical Statistics and Its Applications (6th Edition)
Statistics Through Applications
Intro Stats, Books a la Carte Edition (5th Edition)
Elementary Statistics Using Excel (6th Edition)


 Glencoe Algebra 1, Student Edition, 9780079039897...AlgebraISBN:9780079039897Author:CarterPublisher:McGraw Hill
 Big Ideas Math A Bridge To Success Algebra 1: Stu...AlgebraISBN:9781680331141Author:HOUGHTON MIFFLIN HARCOURTPublisher:Houghton Mifflin Harcourt
 Holt Mcdougal Larson Pre-algebra: Student Edition...AlgebraISBN:9780547587776Author:HOLT MCDOUGALPublisher:HOLT MCDOUGAL
 Functions and Change: A Modeling Approach to Coll...AlgebraISBN:9781337111348Author:Bruce Crauder, Benny Evans, Alan NoellPublisher:Cengage Learning