
Concept explainers
Videos
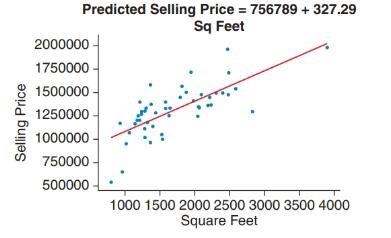
Home Prices and Size The
a. Use the graph to estimate the selling price of a home with 2000 square feet.
b. Use the equation to predict the selling price for a home with 2000 square feet.
c. What is the slope of the regression equation? Interpret the slope of the regression equation.
d. What is the y-intercept of the regression equation? Interpret the y-intercept of the regression equation or explain why it would be inappropriate to do so.
Want to see the full answer?
Check out a sample textbook solution
Chapter 4 Solutions
EP INTRODUCTORY STATISTICS-MYSTATLAB
Additional Math Textbook Solutions
Introduction to Statistical Quality Control
Elementary Statistics ( 3rd International Edition ) Isbn:9781260092561
Statistics: Informed Decisions Using Data (5th Edition)
Intro Stats, Books a la Carte Edition (5th Edition)
Developmental Mathematics (9th Edition)
Statistical Reasoning for Everyday Life (5th Edition)


- Demand for Candy Bars In this problem you will determine a linear demand equation that describes the demand for candy bars in your class. Survey your classmates to determine what price they would be willing to pay for a candy bar. Your survey form might look like the sample to the left. a Make a table of the number of respondents who answered yes at each price level. b Make a scatter plot of your data. c Find and graph the regression line y=mp+b, which gives the number of respondents y who would buy a candy bar if the price were p cents. This is the demand equation. Why is the slope m negative? d What is the p-intercept of the demand equation? What does this intercept tell you about pricing candy bars? Would you buy a candy bar from the vending machine in the hallway if the price is as indicated. Price Yes or No 50 75 1.00 1.25 1.50 1.75 2.00arrow_forwardSales Barnes & Noble had annual sales of $6.8 billion in 2013 and $6.1 billion in 2015. Use the Midpoint Formula to estimate the sales in 2014. Assume that the annual sales followed a linear pattern.arrow_forwardLife Expectancy The average life expectancy in the United States has been rising steadily over the past few decades, as shown in the table. (a) Make a scatter plot of the data. (b) Find and graph the regression line. (c) Use the linear model you found in part (b) to predict the life expectancy in the year 2006. (d) Search the Internet or your campus library to find the actual 2006 average life expectancy. Compare to your answer in part (c).arrow_forward
 Glencoe Algebra 1, Student Edition, 9780079039897...AlgebraISBN:9780079039897Author:CarterPublisher:McGraw Hill
 College Algebra (MindTap Course List)AlgebraISBN:9781305652231Author:R. David Gustafson, Jeff HughesPublisher:Cengage Learning
 Algebra and Trigonometry (MindTap Course List)AlgebraISBN:9781305071742Author:James Stewart, Lothar Redlin, Saleem WatsonPublisher:Cengage Learning
 Functions and Change: A Modeling Approach to Coll...AlgebraISBN:9781337111348Author:Bruce Crauder, Benny Evans, Alan NoellPublisher:Cengage Learning
 College AlgebraAlgebraISBN:9781305115545Author:James Stewart, Lothar Redlin, Saleem WatsonPublisher:Cengage Learning