APPLIED STAT.IN BUS.+ECONOMICS
6th Edition
ISBN: 9781259957598
Author: DOANE
Publisher: RENT MCG
bartleby

Concept explainers

bartleby

Videos

Textbook Question
Book Icon
Chapter 4, Problem 98CE

(a) Make an Excel scatter plot of X = weekly closing price of Dolana stock and Y = weekly closing price of ZalParm stock over 52 consecutive weeks. (b) Describe the scatter plot. Hint: You may need to rescale the X and Y axes to see more detail. (c) Calculate the sample correlation using the Excel function =CORREL. What does it tell you? (d) Select both data columns (including column headings) and make a line chart displaying both series. What does the line chart say about the relationship?

a.

Expert Solution
Check Mark
To determine

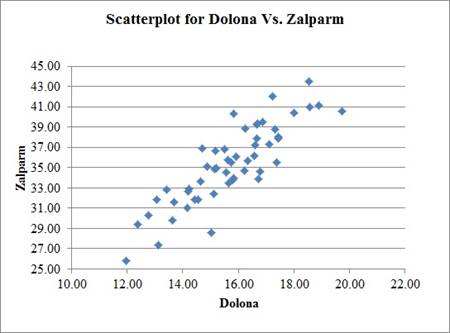
Construct a scatter plot for weekly closing price of Dolona and ZalParm using excel.

Answer to Problem 98CE

The scatter plot for the weekly closing price of Dolona and ZalParm is as follows,

APPLIED STAT.IN BUS.+ECONOMICS, Chapter 4, Problem 98CE , additional homework tip  1

Explanation of Solution

Calculation:

The data represents weekly closing price of Dolona and ZalParm over 52 consecutive weeks.

Scatter plot:

Software procedure:

Step-by-step software procedure to obtain the Scatter plot using EXCEL is as follows:

  • Open an EXCEL file.
  • In column A, enter the column of Dolona, in column B enter the column of ZalParm.
  • Select the data that is to be displayed.
  • Click on Insert > select Scatter icon.
  • Click on the chart > select Layout from the Chart Tools.
  • Select Chart Title > Above Chart.
  • Enter Scatter plot for Dolona Vs. ZalParm   in the dialog box.
  • Select Axis Title > Primary Horizontal Axis Title > Title Below Axis.
  • Enter Dolona in the dialog box.
  • Select Axis Title > Primary Vertical Axis Title > Rotated Title.
  • Enter ZalParm in the dialog box.
  • Thus, the scatter plot for the weekly closing price of Dolona and ZalParm has been obtained using Excel.

b.

Expert Solution
Check Mark
To determine

Explain the relationship between weekly closing price of Dolona and ZalParm and identify whether it is Weak or Strong or Negative or Positive or Linear or Nonlinear.

Answer to Problem 98CE

The weekly closing price of Dolona and ZalParm has a strong positive linear relationship.

Explanation of Solution

Weak relationship:

If the data points in the scatter plot are moderately scattered then there is a weak relationship between X and Y.

Strong relationship:

If all the data points in the scatter plot are moving in a particular direction then it is considered as strong relationship between X and Y.

Negative relationship:

If higher values of one variable in the scatterplot are associated with lower values of the other variable, then it is called a negative relationship.

Positive relationship:

If higher values of one variable in the scatterplot are associated with higher values of the other variable, then it is called a positive relationship.

Linear relationship:

If the data points in the scatter plot are in the form of a straight line then there is a linear relationship between X and Y.

Nonlinear relationship:

If the data points in the scatter plot are not in the form of a straight line then there is a non-linear relationship between X and Y.

A careful inspection of the scatterplot reveals that the data are clustered around a straight line, indicating that there exists a linear relationship between the two variables considered, weekly closing price of Dolona and ZalParm.

Thus, there is a strong positive linear relationship between the weekly closing price of Dolona and ZalParm.

c.

Expert Solution
Check Mark
To determine

Find the correlation coefficient using Excel.

Answer to Problem 98CE

The correlation coefficient for the weekly closing price of Dolona and ZalParm is 0.861.

Explanation of Solution

Calculation:

Correlation:

The correlation coefficient, r, between ordered pairs of variables, (x, y) having sample means x¯ and y¯, for a sample of size n is given as r=i=1n(xix¯)(yiy¯)i=1n(xix¯)2i=1n(yiy¯)2. The correlation coefficient is useful for measuring the strength of the linear relationship between the two variables.

Software procedure:

Step-by-step software procedure to obtain correlation coefficient using EXCEL software is as follows:

  • Open an EXCEL file.
  • Enter the data in the column I in cells I1 to I52 and column J in cells J1 to J52.
  • In cell A1, enter the formula “=CORREL(I1:I52,J1:J52)”.
  • Output using EXCEL software is given below:

APPLIED STAT.IN BUS.+ECONOMICS, Chapter 4, Problem 98CE , additional homework tip  2

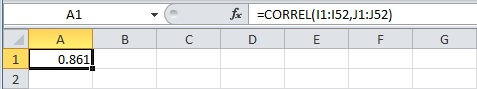
Thus, the Correlation coefficient for the weekly closing price of Dolona and ZalParm is 0.861.

Interpretation of the correlation coefficient:

The correlation coefficient, r, between two linearly related variables is interpreted as follows:

  • A positive value of r indicates a positive linear relationship.
  • A negative value of r indicates a negative linear relationship.
  • A value of r close to 0 indicates a weak linear relationship.
  • A value of r close to 1 indicates a strong positive linear relationship.
  • A value of r close to –1 indicates a strong negative linear relationship.
  • The value r=1 indicates a perfect positive linear relationship.
  • The value r=1 indicates a perfect negative linear relationship.

A careful inspection of the correlation coefficient reveals that it is nearer to 1, indicating that there exists a linear relationship between the two variables considered, weekly closing price of Dolona and ZalParm.

Thus, there is a strong positive linear relationship between the weekly closing price of Dolona and ZalParm.

d.

Expert Solution
Check Mark
To determine

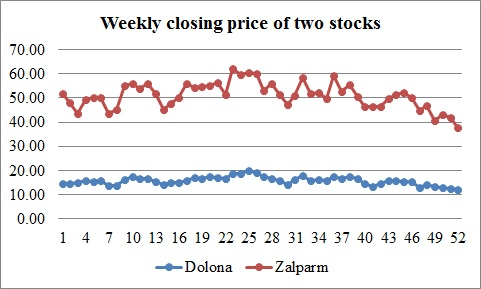
Construct a line Chart for weekly closing price of Dolona and ZalParm using excel.

Answer to Problem 98CE

The line Chart for the weekly closing price of Dolona and ZalParm is as follows,

APPLIED STAT.IN BUS.+ECONOMICS, Chapter 4, Problem 98CE , additional homework tip  3

Explanation of Solution

Calculation:

Line Chart:

Software procedure:

Step-by-step software procedure to obtain the Scatter plot using EXCEL is as follows:

  • Open an EXCEL file.
  • In column A, enter the column of Dolona, in column B enter the column of ZalParm.
  • Select the data that is to be displayed.
  • Click on the Insert tab > select Line icon.
  • Select the option Stacked Line with markers
  • Click on the chart > select Layout from the Chart Tools.
  • Select Chart Title > Above Chart
  • Thus, the Line Chart for the weekly closing price of Dolona and ZalParm has been obtained using Excel.
  • A careful inspection of the line chart shows that stocks of Dolona and ZalParm moves in the same direction and together, though the stock price of ZalParm has more deviations than that of the Dolona.

Want to see more full solutions like this?

Subscribe now to access step-by-step solutions to millions of textbook problems written by subject matter experts!

Chapter 4 Solutions

APPLIED STAT.IN BUS.+ECONOMICS

Ch. 4.2 - Prob. 11SECh. 4.2 - Prob. 12SECh. 4.2 - (a) Write the Excel function for the 10 percent...Ch. 4.2 - Prob. 14SECh. 4.2 - Prob. 15SECh. 4.2 - Spirit Airlines kept track of the number of empty...Ch. 4.2 - CitiBank recorded the number of customers to use a...Ch. 4.2 - On Friday night, the owner of Chez Pierre in...Ch. 4.2 - Prob. 19SECh. 4.2 - The number of internet users in Latin America grew...Ch. 4.3 - (a) Find the mean and standard deviation for each...Ch. 4.3 - For each data set: (a) Find the mean. (b) Find the...Ch. 4.3 - In fuel economy tests in city driving conditions,...Ch. 4.3 - Over the past month, Bobs bowling score mean was...Ch. 4.3 - Prob. 25SECh. 4.3 - Prob. 26SECh. 4.3 - (a) Find the coefficient of variation for prices...Ch. 4.3 - Prob. 28SECh. 4.3 - Noodles and Company tested consumer reaction to...Ch. 4.4 - (a) By Chebyshevs Theorem, at least how many...Ch. 4.4 - An exam has a mean of 70 with a standard deviation...Ch. 4.4 - Prob. 32SECh. 4.4 - The mean collection period for accounts receivable...Ch. 4.4 - Convert each individual data value to a...Ch. 4.4 - Prob. 35SECh. 4.4 - Prob. 36SECh. 4.4 - Find the original data value corresponding to each...Ch. 4.4 - CitiBank recorded the number of customers to use a...Ch. 4.4 - Prob. 39SECh. 4.5 - Scores on an accounting exam ranged from 42 to 96,...Ch. 4.5 - In 2007, total compensation (in thousands of...Ch. 4.5 - Waiting times (minutes) for a table at Joeys BBQ...Ch. 4.5 - Coffee temperatures (degrees Fahrenheit) at a...Ch. 4.5 - Prob. 44SECh. 4.5 - On San Martin Boulevard, embedded sensors kept...Ch. 4.5 - Prob. 46SECh. 4.5 - Prob. 47SECh. 4.6 - For each X-Y data set (n = 12): (a) Make a scatter...Ch. 4.6 - Closing prices of two stocks are recorded for 50...Ch. 4.6 - Prob. 50SECh. 4.6 - Prob. 51SECh. 4.7 - Estimate the mean from this table of grouped data...Ch. 4.7 - Estimate the mean from the following table of...Ch. 4 - What are descriptive statistics? How do they...Ch. 4 - Explain each concept: (a) center, (b) variability,...Ch. 4 - Prob. 3CRCh. 4 - List strengths and weaknesses of each measure of...Ch. 4 - Prob. 5CRCh. 4 - (a) What is a bimodal distribution? (b) Explain...Ch. 4 - Prob. 7CRCh. 4 - Prob. 8CRCh. 4 - (a) Which standard deviation formula (population,...Ch. 4 - (a) To what kind of data does Chebyshevs Theorem...Ch. 4 - Prob. 11CRCh. 4 - Prob. 12CRCh. 4 - Prob. 13CRCh. 4 - Prob. 14CRCh. 4 - (a) Explain the method of medians for calculating...Ch. 4 - (a) What is a box plot? What does it tell us? (b)...Ch. 4 - Prob. 17CRCh. 4 - Prob. 18CRCh. 4 - Prob. 19CRCh. 4 - (a) What is kurtosis? (b) Sketch a platykurtic...Ch. 4 - Prob. 54CECh. 4 - If the mean asset turnover for retail firms is...Ch. 4 - Prob. 56CECh. 4 - During a rock concert, the noise level (in...Ch. 4 - Bags of jelly beans have a mean weight of 396 gm...Ch. 4 - Based on experience, the Ball Corporations...Ch. 4 - SAT scores for the entering class of 2010 at...Ch. 4 - Prob. 61CECh. 4 - The average time a Boulder High varsity lacrosse...Ch. 4 - Prob. 63CECh. 4 - Below are monthly rents paid by 30 students who...Ch. 4 - How many days in advance do travelers purchase...Ch. 4 - The durations (minutes) of 26 electric power...Ch. 4 - The U.S. Postal Service will ship a Priority Mail...Ch. 4 - Prob. 68CECh. 4 - Prob. 69CECh. 4 - Prob. 70CECh. 4 - Prob. 71CECh. 4 - A plumbing suppliers mean monthly demand for vinyl...Ch. 4 - Prob. 73CECh. 4 - Analysis of investment portfolio returns over a...Ch. 4 - Prob. 75CECh. 4 - Caffeine content in a 5-ounce cup of brewed coffee...Ch. 4 - Prob. 77CECh. 4 - Prob. 78CECh. 4 - Prob. 79CECh. 4 - Prob. 80CECh. 4 - Prob. 81CECh. 4 - Prob. 82CECh. 4 - Prob. 83CECh. 4 - The median waiting time for a liver transplant in...Ch. 4 - A small suburban community agreed to purchase...Ch. 4 - A companys contractual trigger point for a union...Ch. 4 - Prob. 87CECh. 4 - (a) Enter the Excel function...Ch. 4 - Note: In each of the following tables, the upper...Ch. 4 - This table shows the distribution of winning times...Ch. 4 - The self-reported number of hours worked per week...Ch. 4 - How long does it take to fly from Denver to...Ch. 4 - (a) Make an Excel scatter plot of X = 1990 assault...Ch. 4 - (a) Make an Excel scatter plot of X = airspeed...Ch. 4 - Prob. 97CECh. 4 - (a) Make an Excel scatter plot of X = weekly...Ch. 4 - Prob. 99CECh. 4 - Prob. 1ERQCh. 4 - Which is not an ethical obligation of a...Ch. 4 - Prob. 3ERQCh. 4 - Prob. 4ERQCh. 4 - Give the type of measurement (nominal, ordinal,...Ch. 4 - Prob. 6ERQCh. 4 - To choose a sample of 12 students from a...Ch. 4 - Which of the following is not a reason for...Ch. 4 - Which statement is correct? Why not the others? a....Ch. 4 - Prob. 10ERQCh. 4 - The management of a theme park obtained a random...Ch. 4 - Which one of the following is true? Why not the...Ch. 4 - Prob. 13ERQCh. 4 - Prob. 14ERQCh. 4 - Here are the ages of a random sample of 20 CEOs...Ch. 4 - Prob. 16ERQCh. 4 - Prob. 17ERQCh. 4 - Prob. 18ERQCh. 4 - Which is not a characteristic of using a log scale...
Knowledge Booster
Background pattern image
Statistics
Learn more about
Need a deep-dive on the concept behind this application? Look no further. Learn more about this topic, statistics and related others by exploring similar questions and additional content below.
Recommended textbooks for you
Text book image
Glencoe Algebra 1, Student Edition, 9780079039897...
Algebra
ISBN:9780079039897
Author:Carter
Publisher:McGraw Hill
Text book image
Big Ideas Math A Bridge To Success Algebra 1: Stu...
Algebra
ISBN:9781680331141
Author:HOUGHTON MIFFLIN HARCOURT
Publisher:Houghton Mifflin Harcourt
Text book image
Holt Mcdougal Larson Pre-algebra: Student Edition...
Algebra
ISBN:9780547587776
Author:HOLT MCDOUGAL
Publisher:HOLT MCDOUGAL
Correlation Vs Regression: Difference Between them with definition & Comparison Chart; Author: Key Differences;https://www.youtube.com/watch?v=Ou2QGSJVd0U;License: Standard YouTube License, CC-BY
Correlation and Regression: Concepts with Illustrative examples; Author: LEARN & APPLY : Lean and Six Sigma;https://www.youtube.com/watch?v=xTpHD5WLuoA;License: Standard YouTube License, CC-BY