
Statistical Reasoning for Everyday Life Plus MyLab Statistics with Pearson eText -- 18 Week Access Card Package (5th Edition)
5th Edition
ISBN: 9780135990278
Author: Bennett, Jeffrey O., Briggs, William L., Triola, Mario F.
Publisher: PEARSON
expand_more
expand_more
format_list_bulleted
Concept explainers
Videos
Textbook Question
Chapter 4.1, Problem 33E
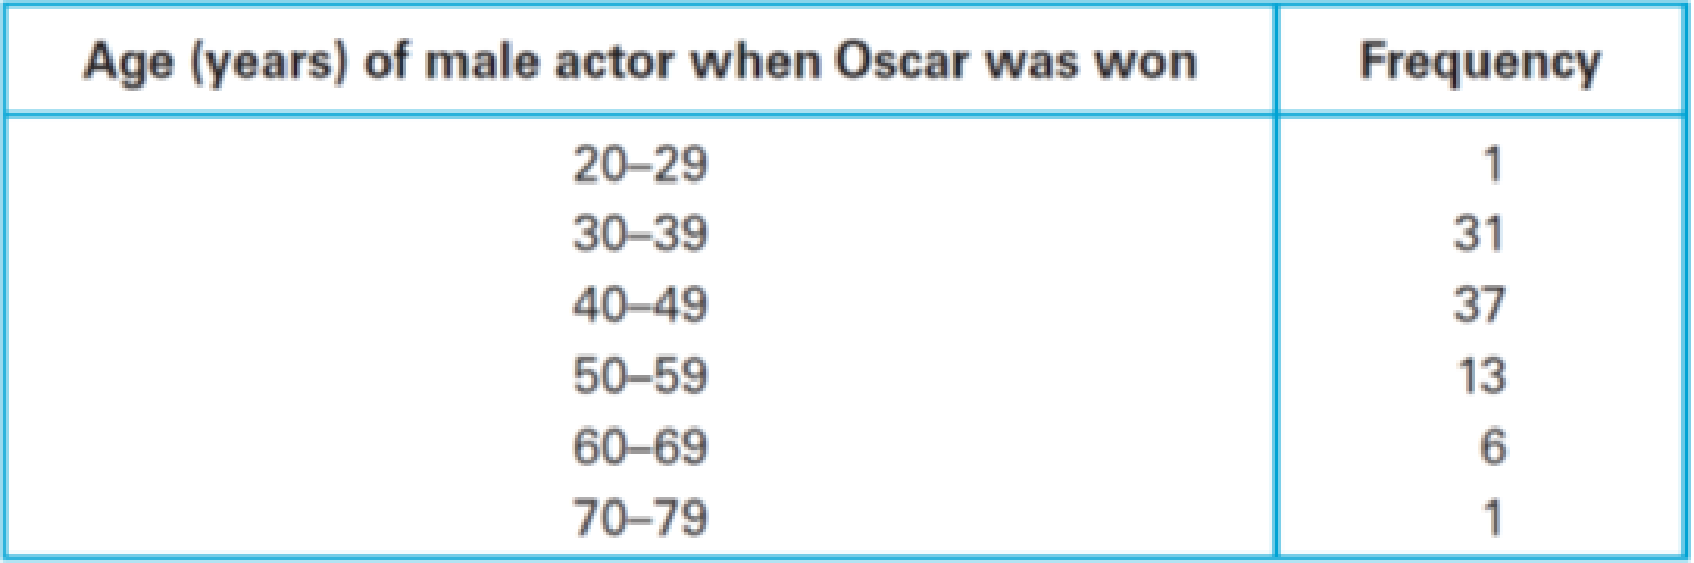
Weighted Mean. In Exercises 32–35, find the mean of the data summarized in the frequency table by using the middle of each bin and the frequency for each bin. Also, compare the computed means to these the actual means obtained using the original list of data values: (Exercise 32) 36.2 years; (Exercise 33) 44.1 years; (Exercise 34) 224.3 (1000 cells/μL); (Exercise 35) 255.1 (1000 cells/μL).
33.
Expert Solution & Answer
Want to see the full answer?
Check out a sample textbook solution
Students have asked these similar questions
In Exercises 13–20, determine whether the data are from a discrete or continuous data set.
Criminal Forensics When studying the relationship between lengths of feet and heights so that footprint evidence at a crime scene can be used to estimate the height of the suspect, a researcher records the exact lengths of feet from a large sample of random subjects.
of
This frequency table depicts the average hours spent on social media use for students in PSY201 class.
Hours
Frequency
4
3.5
3
2.5
2
1.5
1
0.5
0
10
5
5
3
7
16
0
5
3
How many students spent at least 3 hours on social media in PSY201?
Use the following table to answer questions 6–9.
Monthly Water Bills
Jan
Feb
Mar Apr May June July Aug Sept
Oct
Nov
Dec
$40
$42
$40
$38
$48
$50
$58
$62
$56
$46
$44
$44
6. Write the formula for the mean water bill for the entire year using sigma
notation and determine that mean. Round your answer to the nearest cent.
Chapter 4 Solutions
Statistical Reasoning for Everyday Life Plus MyLab Statistics with Pearson eText -- 18 Week Access Card Package (5th Edition)
Ch. 4.1 - Average. Define and distinguish among mean,...Ch. 4.1 - Outliers. What are outliers? Describe the effects...Ch. 4.1 - Average Confusion. Briefly describe at least two...Ch. 4.1 - Weighting. What is a weighted mean, and when is it...Ch. 4.1 - Does It Make Sense? For Exercises 59, determine...Ch. 4.1 - Does It Make Sense? For Exercises 59, determine...Ch. 4.1 - Mode. In an analysis of salaries paid to sales...Ch. 4.1 - Employment Data. A survey asked people their...Ch. 4.1 - Mean Wage. To find the mean wage of restaurant...Ch. 4.1 - Mean, Median, and Mode. In Exercises 1016, find...
Ch. 4.1 - Mean, Median, and Mode. In Exercises 1016, find...Ch. 4.1 - Mean, Median, and Mode. In Exercises 1016, find...Ch. 4.1 - Mean, Median, and Mode. In Exercises 1016, find...Ch. 4.1 - Mean, Median, and Mode. In Exercises 1016, find...Ch. 4.1 - Mean, Median, and Mode. In Exercises 1016, find...Ch. 4.1 - Mean, Median, and Mode. In Exercises 1016, find...Ch. 4.1 - Cell Phone Radiation. Listed below are...Ch. 4.1 - Alphabetic States. The states of Alabama, Alaska,...Ch. 4.1 - Outlier Coke. The contents of cans of regular...Ch. 4.1 - Raising Your Grade. Suppose you have scores of 80,...Ch. 4.1 - Raising Your Grade. Suppose you have scores of 60,...Ch. 4.1 - Comparing Data. In Exercises 2225, find the mean...Ch. 4.1 - Comparing Data. In Exercises 2225, find the mean...Ch. 4.1 - Comparing Data. In Exercises 2225, find the mean...Ch. 4.1 - Prob. 25ECh. 4.1 - Weighted Mean. Compute the weighte means in...Ch. 4.1 - Class Grade. Ryan is taking an advanced math class...Ch. 4.1 - GPA. One common system for computing a grade point...Ch. 4.1 - Prob. 29ECh. 4.1 - Prob. 30ECh. 4.1 - 31. Stockholder Voting. A small company has six...Ch. 4.1 - Weighted Mean. In Exercises 3235, find the mean of...Ch. 4.1 - Weighted Mean. In Exercises 3235, find the mean of...Ch. 4.1 - Weighted Mean. In Exercises 3235, find the mean of...Ch. 4.1 - Weighted Mean. In Exercises 3235, find the mean of...Ch. 4.1 - U.S. Population Center. Imagine taking a huge flat...Ch. 4.2 - Modes. Distinguish between a uniform distribution...Ch. 4.2 - Prob. 2ECh. 4.2 - Prob. 3ECh. 4.2 - Prob. 4ECh. 4.2 - Prob. 5ECh. 4.2 - Does It Make Sense? For Exercises 58, determine...Ch. 4.2 - Does It Make Sense? For Exercises 58, determine...Ch. 4.2 - Does It Make Sense? For Exercises 58, determine...Ch. 4.2 - Prob. 9ECh. 4.2 - Distributions. In Exercises 912, describe the...Ch. 4.2 - Distributions. In Exercises 912, describe the...Ch. 4.2 - Distributions. In Exercises 912, describe the...Ch. 4.2 - Baseball Salaries. In a recent year, the 868...Ch. 4.2 - Boston Rainfall. The daily rainfall amounts (in...Ch. 4.2 - Describing Distributions. For each distribution...Ch. 4.2 - Describing Distributions. For each distribution...Ch. 4.2 - Describing Distributions. For each distribution...Ch. 4.2 - Describing Distributions. For each distribution...Ch. 4.2 - Describing Distributions. For each distribution...Ch. 4.2 - Describing Distributions. For each distribution...Ch. 4.2 - Describing Distributions. For each distribution...Ch. 4.2 - Describing Distributions. For each distribution...Ch. 4.2 - Describing Distributions. For each distribution...Ch. 4.2 - Describing Distributions. For each distribution...Ch. 4.2 - Describing Distributions. For each distribution...Ch. 4.2 - Describing Distributions. For each distribution...Ch. 4.3 - Variation Matters. Consider two grocery stores at...Ch. 4.3 - Variation Measures. Briefly distinguish between...Ch. 4.3 - Quartiles and Percentiles. Briefly describe how...Ch. 4.3 - Standard Deviation. Describe the process of...Ch. 4.3 - Does It Make Sense? For Exercises 58, determine...Ch. 4.3 - Does It Make Sense? For Exercises 58, determine...Ch. 4.3 - Does It Make Sense? For Exercises 58, determine...Ch. 4.3 - Does It Make Sense? For Exercises 58, determine...Ch. 4.3 - Prob. 9ECh. 4.3 - Range and Standard Deviation. Exercises 916 each...Ch. 4.3 - Range and Standard Deviation. Exercises 916 each...Ch. 4.3 - Range and Standard Deviation. Exercises 916 each...Ch. 4.3 - Range and Standard Deviation. Exercises 916 each...Ch. 4.3 - Range and Standard Deviation. Exercises 916 each...Ch. 4.3 - Range and Standard Deviation. Exercises 916 each...Ch. 4.3 - Range and Standard Deviation. Exercises 916 each...Ch. 4.3 - Prob. 17ECh. 4.3 - Comparing Variation. In Exercises 1720, find the...Ch. 4.3 - Prob. 19ECh. 4.3 - Comparing Variation. In Exercises 1720, find the...Ch. 4.3 - Calculating Percentiles. A statistics professor...Ch. 4.3 - Calculating Percentiles. A data set consists of...Ch. 4.3 - Understanding Standard Deviation. The following...Ch. 4.3 - Understanding Standard Deviation. The following...Ch. 4.3 - Comparing Data Sets. For each of Exercises 2528,...Ch. 4.3 - Comparing Data Sets. For each of Exercises 2528,...Ch. 4.3 - Comparing Data Sets. For each of Exercises 2528,...Ch. 4.3 - Comparing Data Sets. For each of Exercises 2528,...Ch. 4.3 - Manufacturing. You are in charge of a...Ch. 4.3 - Prob. 30ECh. 4.3 - Prob. 31ECh. 4.3 - Prob. 32ECh. 4.4 - False Positive and False Negative. Professional...Ch. 4.4 - Positive Test Result. A professional soccer player...Ch. 4.4 - Prob. 3ECh. 4.4 - Prob. 4ECh. 4.4 - Does It Make Sense? For Exercises 58, determine...Ch. 4.4 - Does It Make Sense? For Exercises 58, determine...Ch. 4.4 - Does It Make Sense? For Exercises 58, determine...Ch. 4.4 - Does It Make Sense? For Exercises 58, determine...Ch. 4.4 - Prob. 9ECh. 4.4 - Passing Percentages. The table below shows the...Ch. 4.4 - Test Scores. The table below shows eighth-grade...Ch. 4.4 - Test Scores. Consider the following table...Ch. 4.4 - Prob. 13ECh. 4.4 - Prob. 14ECh. 4.4 - Basketball Records. Consider the following...Ch. 4.4 - Better Drug. Two drugs, A and B, were tested on a...Ch. 4.4 - Prob. 17ECh. 4.4 - Disease Test. Suppose a test for a disease is 80%...Ch. 4.4 - Prob. 19ECh. 4.4 - Drug Trials. (This problem is based on an example...Ch. 4.4 - HIV Risks. The New York State Department of Health...Ch. 4 - Chocolate Chips. Listed below are counts of the...Ch. 4 - Prob. 2CRECh. 4 - a. What is the standard deviation for a data set...Ch. 4 - When you add the earthquake magnitudes 2.45, 3.62,...Ch. 4 - Prob. 2CQCh. 4 - Prob. 3CQCh. 4 - Prob. 4CQCh. 4 - Prob. 5CQCh. 4 - Prob. 6CQCh. 4 - A histogram is constructed for a large set of...Ch. 4 - Prob. 8CQCh. 4 - Prob. 9CQCh. 4 - Identify the names of the components that...
Knowledge Booster


Learn more about
Need a deep-dive on the concept behind this application? Look no further. Learn more about this topic, statistics and related others by exploring similar questions and additional content below.Similar questions
- For Exercises 7–10, (a) compute the arithmetic mean and (b) indicate whether it is a 7. There are 10 salespeople employed by Midtown Ford. The number of new cars statistic or a parameter. Sold last month by the respective salespeople were: 15, 23, 4, 19, 18, 10, 10, 0 28, 19. Dve order company counted the number of incoming calls per day to the compa- Ivs toll-free number during the first 7 days in May: 14, 24, 19, 31, 36, 26, 17.arrow_forward2.) Explain why the relative frequency column of a frequency table might not sum to 1.0.arrow_forwardA study was done of 6 patients admitted to a hospital. Their ages (x) and systolic blood pressure (y) was recorded. Systolic blood pressure (y) Age (x) 43 123 48 125 56 135 61 143 67 145 70 152arrow_forward
- During one shift, the express lane clerk recorded how many times customers violated the "10 items or less" rule for his lane. In particular, he recorded how many items over the limit each violator placed on the conveyor belt. This data is summarized in the histogram below. NOTE: The last class actually represents "7 or more items," not just 7 items. Frequency 14+ 12- 10 ans = 8- 4 2 0.5 1.5 2.5 3.5 4.5 5.5 6.5 7.5 #items over 10 What is the frequency of times the limit was exceeded by less than 6 items?arrow_forwardDuring one shift, the express lane clerk recorded how many times customers violated the "10 items or less" rule for his lane. In particular, he recorded how many items over the limit each violator placed on the conveyor belt. This data is summarized in the histogram below. NOTE: The last class actually represents "7 or more items," not just 7 items. Frequency 14- 12 10- 8 4 2- 0.5 Answer: 1.5 2.5 3.5 4.5 5.5 #items over 10 6.5 7.5 What is the frequency of times the limit was exceeded by more than 2 items? times Qarrow_forwardDuring one shift, the express lane clerk recorded how many times customers violated the "10 items or less" rule for his lane. In particular, he recorded how many items over the limit each violator placed on the conveyor belt. This data is summarized in the histogram below. NOTE: The last class actually represents "7 or more items," not just 7 items. Frequency 144 12- 10+ 8- 0.5 1.5 2.5 3.5 4.5 5.5 6.5 7.5 #items over 10 Q What is the frequency of times the limit was exceeded by at least 2 items? Answer: timesarrow_forward
- In Exercises 13–20, determine whether the data are from a discrete or continuous data set. CHIS Among the subjects surveyed as part of the California Health Interview Survey (CHIS), several subjects are randomly selected and their heights are recorded.arrow_forwardThe frequency distribution shown in the figure lists the annual salaries of the managers at Universal Manufacturing of Melonville. Construct a histogram to represent the data.arrow_forwardDuring one shift, the express lane clerk recorded how many times customers violated the "10 items or less" rule for his lane. In particular, he recorded how many items over the limit each violator placed on the conveyor belt. This data is summarized in the histogram below. NOTE: The last class actually represents "7 or more items," not just 7 items. Frequency 12+ 298 ans = 10- a 2 0.5 1.5 2.5 3.5 4.5 5.5 6.5 7.5 # items over 10 What is the frequency of times the limit was exceeded by at least 3 items?arrow_forward
- The table below shows the gold medal Olympic times (in seconds) for the 200-meter run. Data are shown for four of the first five Olympics of the 1900s and four more recent Olympics in the 2000s. Complete parts (a) through (c) below.arrow_forwardDuring one shift, the express lane clerk recorded how many times customers violated the "10 items or less" rule for his lane. In particular, he recorded how many items over the limit each violator placed on the conveyor belt. This data is summarized in the histogram below. NOTE: The last class actually represents "7 or more items," not just 7 items. Frequency 12+ 10- 8 6 4 2 0.5 1.5 2.5 3.5 4.5 5.5 6.5 7.5 #items over 10 Q What is the most frequent number of over-the-limit items for this data set? ans = What is the frequency of the most frequent number of over-the-limit items? ans =arrow_forwardSpeed cameras (SC) are used to reduce the risk of accidents in accident-prone zones in metropolitan cities. To study the effectiveness of speed cameras, transport engineers would like to compare the average number of accidents in junction A (with SC) and junction B (without SC). The number of accidents in 105 weeks in two junctions are provided below. Junction A with SC Junction B without SC Number of Accidents 01 2 3 4 5 6 7+ Observed frequency 40 20 15 16 10 3 1 0 Number of Accidents 0 1 2 3 4 5 6 7+ Observed frequency 25 24 18 15 18 41 0 Find an estimates of the average number of accidents per week in two different junctions.arrow_forward
arrow_back_ios
SEE MORE QUESTIONS
arrow_forward_ios
Recommended textbooks for you
 MATLAB: An Introduction with ApplicationsStatisticsISBN:9781119256830Author:Amos GilatPublisher:John Wiley & Sons Inc
 Probability and Statistics for Engineering and th...StatisticsISBN:9781305251809Author:Jay L. DevorePublisher:Cengage Learning
 Statistics for The Behavioral Sciences (MindTap C...StatisticsISBN:9781305504912Author:Frederick J Gravetter, Larry B. WallnauPublisher:Cengage Learning
 Elementary Statistics: Picturing the World (7th E...StatisticsISBN:9780134683416Author:Ron Larson, Betsy FarberPublisher:PEARSON
 The Basic Practice of StatisticsStatisticsISBN:9781319042578Author:David S. Moore, William I. Notz, Michael A. FlignerPublisher:W. H. Freeman
 Introduction to the Practice of StatisticsStatisticsISBN:9781319013387Author:David S. Moore, George P. McCabe, Bruce A. CraigPublisher:W. H. Freeman
MATLAB: An Introduction with Applications
Statistics
ISBN:9781119256830
Author:Amos Gilat
Publisher:John Wiley & Sons Inc
Probability and Statistics for Engineering and th...
Statistics
ISBN:9781305251809
Author:Jay L. Devore
Publisher:Cengage Learning
Statistics for The Behavioral Sciences (MindTap C...
Statistics
ISBN:9781305504912
Author:Frederick J Gravetter, Larry B. Wallnau
Publisher:Cengage Learning
Elementary Statistics: Picturing the World (7th E...
Statistics
ISBN:9780134683416
Author:Ron Larson, Betsy Farber
Publisher:PEARSON
The Basic Practice of Statistics
Statistics
ISBN:9781319042578
Author:David S. Moore, William I. Notz, Michael A. Fligner
Publisher:W. H. Freeman
Introduction to the Practice of Statistics
Statistics
ISBN:9781319013387
Author:David S. Moore, George P. McCabe, Bruce A. Craig
Publisher:W. H. Freeman
The Shape of Data: Distributions: Crash Course Statistics #7; Author: CrashCourse;https://www.youtube.com/watch?v=bPFNxD3Yg6U;License: Standard YouTube License, CC-BY
Shape, Center, and Spread - Module 20.2 (Part 1); Author: Mrmathblog;https://www.youtube.com/watch?v=COaid7O_Gag;License: Standard YouTube License, CC-BY
Shape, Center and Spread; Author: Emily Murdock;https://www.youtube.com/watch?v=_YyW0DSCzpM;License: Standard Youtube License