
Concept explainers
Videos
Use a calculator with an
Average annual premiums for employer-sponsored family health insurance policies more than doubled over 11 years The bar graph shows the average cost of a family health insurance plan in the United States for six selected years from 2000 through 2011.
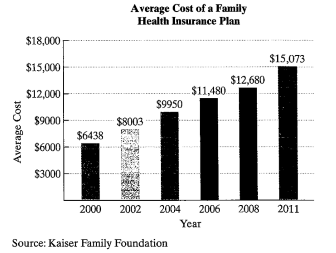
The data can be modeled by
in which f(x) and g(x) represent the average cost of a family health insurance plan x years after 2000. Use these functions to solve Exercises 71–72. Where necessary, round answers to the nearest whole dollar.
a. According to the linear model, what was the average cost of a family health insurance plan in 2011?
b. According to the exponential model, what was the average cost of a family health insurance plan in 2011?
c. Which function is a better model for the data in 2011?
Want to see the full answer?
Check out a sample textbook solution
Chapter 4 Solutions
Algebra and Trigonometry (5th Edition) 5th edition by Blitzer, Robert F. (2012) Hardcover


 Algebra & Trigonometry with Analytic GeometryAlgebraISBN:9781133382119Author:SwokowskiPublisher:Cengage