
Concept explainers
Videos
Use a calculator with an
The bar graph shows the percentage of U.S. high school seniors who applied to more than three colleges for selected years from 1980 through 2013.
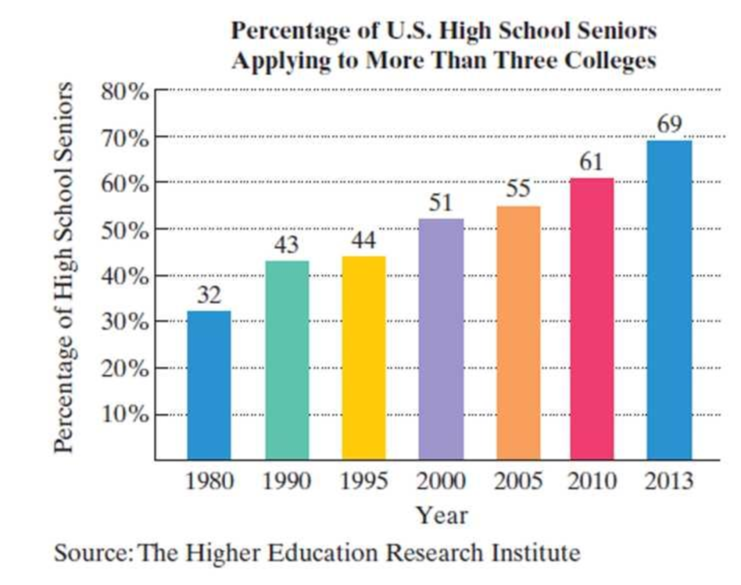
The data can be modeled by
in which f(x) and g(x) represent the percentage of high school seniors who applied to more than three colleges x years after 1980. Use these functions to solve Exercises 71–72. Where necessary, round answers to the nearest percent.
72. a. According to the linear model, what percentage of high school seniors applied to more than three colleges in 2010?
b. According to the exponential model, what percentage of high school seniors applied to more than three colleges in 2010?
c. Which function is a better model for the data shown by the bar graph in 2010?
Want to see the full answer?
Check out a sample textbook solution
Chapter 4 Solutions
EBK COLLEGE ALGEBRA ESSENTIALS


- In Exercises 7–12, describe the relationship between the two quantities.arrow_forwardFor Exercises 33–38, find the exact value of each expression without the use of a calculator. (See Example 5)arrow_forwardThe average amount A (in pounds per person) of fish and shellfish consumed in the UnitedStates during the period 1992–2001 can be modeled by A = (3.2x + 260)/(52x + 3800) where x is the number of years since 1992.Rewrite the model so that it has only whole number coefficients. Then simplify the model.arrow_forward
- In Exercises 67–70, use the following function.arrow_forwardsection 4.1 #30 In Exercises 25–30, determine whether the association between the two variables is positive or negative. Weekly ice cream sales and weekly average temperaturearrow_forwardQ. Table provided gives data on gross domestic product (GDP) for the United States for the years 1959–2005. a. Plot the GDP data in current and constant (i.e., 2000) dollars against time. b. Letting Y denote GDP and X time (measured chronologically starting with 1 for 1959, 2 for 1960, through 47 for 2005), see if the following model fits the GDP data: Yt = β1 + β2 Xt + ut Estimate this model for both current and constant-dollar GDP. c. How would you interpret β2? d. If there is a difference between β2 estimated for current-dollar GDP and that estimated for constant-dollar GDP, what explains the difference? e. From your results what can you say about the nature of inflation in the United States over the sample period?arrow_forward
- America is getting older. The graph shows the projected elderly U.S. population for ages 65–84 and for ages 85 and older.The formula E = 5.8√x + 56.4 models the projected number of elderly Americans ages 65–84, E, in millions, x years after 2020.a. Use the formula to find the projected increase in the number of Americans ages 65–84, in millions, from 2030 to 2060. Express this difference in simplified radicalform.b. Use a calculator and write your answer in part (a) to the nearest tenth. Does this rounded decimal overestimate or underestimate the difference in the projected data shown by the bar graph ? By how much?arrow_forwardFor Exercises 49–52, rewrite the equation so that the coefficient on x is positive.arrow_forwardQ1. The table provided gives data on indexes of output per hour (X) and real compensation per hour (Y) for the business and nonfarm business sectors of the U.S. economy for 1960–2005. The base year of the indexes is 1992 = 100 and the indexes are seasonally adjusted. a. Plot Y against X for the two sectors separately. b. What is the economic theory behind the relationship between the two variables? Does the scattergram support the theory? c. Estimate the OLS regression of Y on X. Note: on the table ( 1. Output refers to real gross domestic product in the sector. 2. Wages and salaries of employees plus employers’ contributions for social insurance and private benefit plans. 3. Hourly compensation divided by the consumer price index for all urban consumers for recent quarters.) Thank you!arrow_forward
- The file P02_26.xlsx lists sales (in millions of dollars) of Dell Computer during the period 1987–1997 (where year 1 corresponds to 1987). Year Sales 1 69 2 159 3 258 4 389 5 546 6 890 7 2014 8 2873 9 3475 10 5296 11 7759 a. Fit a power and an exponential trend curve to these data. Which fits the data better? b. Use your part a answer to predict 1999 sales for Dell. c. Use your part a answer to describe how the sales of Dell have grown from year to year.arrow_forwardNational Debt The size of the total debt owed by the UnitedStates federal government continues to grow. In fact,according to the Department of the Treasury, the debt perperson living in the United States is approximately $53,000(or over $140,000 per U.S. household). The following datarepresent the U.S. debt for the years 2001–2014. Since thedebt D depends on the year y, and each input correspondsto exactly one output, the debt is a function of the year. SoD1y2 represents the debt for each year y. Source: www.treasurydirect.govDebt (billions Debt (billionsYear of dollars) Year of dollars)2001 5807 2008 10,0252002 6228 2009 11,9102003 6783 2010 13,5622004 7379 2011 14,7902005 7933 2012 16,0662006 8507 2013 16,7382007 9008 2014 17,824 (a) Plot the points 12001, 58072, 12002, 62282, and so on ina Cartesian plane.(b) Draw a line segment from the point 12001, 58072 to12006, 85072. What does the slope of this line segmentrepresent?(c) Find the average rate of change of the debt from 2002…arrow_forwardEXERCISE 1.3arrow_forward
 Algebra & Trigonometry with Analytic GeometryAlgebraISBN:9781133382119Author:SwokowskiPublisher:Cengage