The bar graph shows the percentage of people 25 years of age and older who were college graduates in the United States for eight selected years. The functions f ( x ) = 6.43 ( 1.027 ) x and g ( x ) = 40.9 1 + 6.6 e − 0.049 x model the percentage of college graduates, among people ages 25 and older; f ( x ) or g ( x ) , x years after 1950. Use these functions to solve Exercises 75–76. 75. Which function is a better model for the percentage who were college graduates in 2014?
The bar graph shows the percentage of people 25 years of age and older who were college graduates in the United States for eight selected years. The functions f ( x ) = 6.43 ( 1.027 ) x and g ( x ) = 40.9 1 + 6.6 e − 0.049 x model the percentage of college graduates, among people ages 25 and older; f ( x ) or g ( x ) , x years after 1950. Use these functions to solve Exercises 75–76. 75. Which function is a better model for the percentage who were college graduates in 2014?
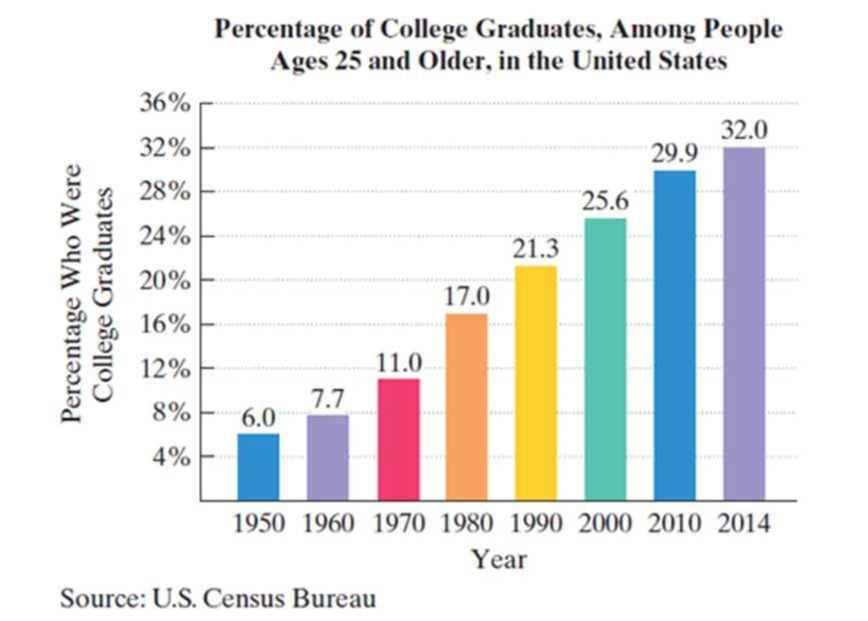
The bar graph shows the percentage of people 25 years of age and older who were college graduates in the United States for eight selected years.
The functions
f
(
x
)
=
6.43
(
1.027
)
x
and
g
(
x
)
=
40.9
1
+
6.6
e
−
0.049
x
model the percentage of college graduates, among people ages 25 and older; f(x) or g(x), x years after 1950. Use these functions to solve Exercises 75–76.
75. Which function is a better model for the percentage who were college graduates in 2014?
Need a deep-dive on the concept behind this application? Look no further. Learn more about this topic, algebra and related others by exploring similar questions and additional content below.
Finding The Focus and Directrix of a Parabola - Conic Sections; Author: The Organic Chemistry Tutor;https://www.youtube.com/watch?v=KYgmOTLbuqE;License: Standard YouTube License, CC-BY


 Glencoe Algebra 1, Student Edition, 9780079039897...AlgebraISBN:9780079039897Author:CarterPublisher:McGraw Hill
 Intermediate AlgebraAlgebraISBN:9781285195728Author:Jerome E. Kaufmann, Karen L. SchwittersPublisher:Cengage Learning

 Big Ideas Math A Bridge To Success Algebra 1: Stu...AlgebraISBN:9781680331141Author:HOUGHTON MIFFLIN HARCOURTPublisher:Houghton Mifflin Harcourt
 Algebra & Trigonometry with Analytic GeometryAlgebraISBN:9781133382119Author:SwokowskiPublisher:Cengage