
Videos
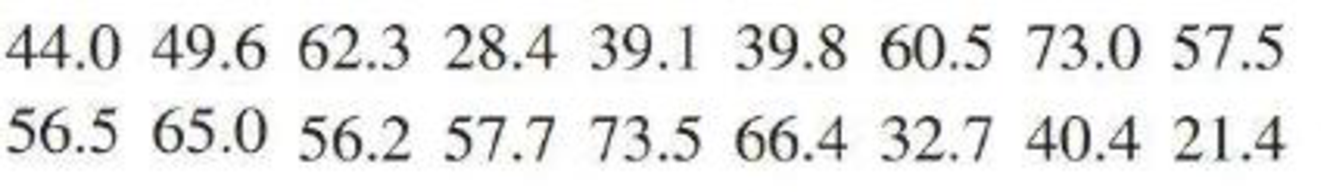
The accompanying data are consistent with summary statistics that appeared in the paper “Shape of Glass and Amount of Alcohol Poured: Comparative Study of Effect of Practice and Concentration” (British Medical Journal [2005]: 1512-1514). Data represent the actual amount poured (in ml) into a tall, slender glass for individuals who were asked to pour 44.3 ml (1.5 ounces). Calculate and interpret the values of the

Trending nowThis is a popular solution!

Chapter 4 Solutions
INTRODUCTION TO STATISTICS & DATA ANALYS
Additional Math Textbook Solutions
Statistics Through Applications
Elementary Statistics: A Step By Step Approach
Probability and Statistics for Engineering and the Sciences
Statistics for Business and Economics (13th Edition)
APPLIED STAT.IN BUS.+ECONOMICS
EBK STATISTICAL TECHNIQUES IN BUSINESS


 Glencoe Algebra 1, Student Edition, 9780079039897...AlgebraISBN:9780079039897Author:CarterPublisher:McGraw Hill