ELEMENTARY STATISTICS-ALEKS ACCESS CODE
3rd Edition
ISBN: 9781265787219
Author: Navidi
Publisher: MCG
bartleby

Concept explainers

bartleby

Videos

Textbook Question
Book Icon
Chapter 4.2, Problem 23E

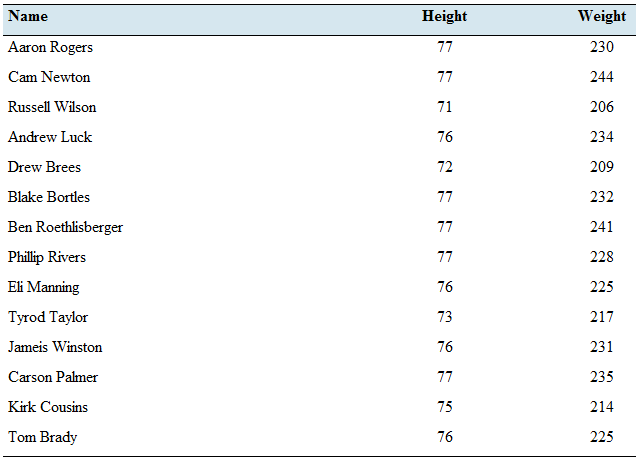
Pass the ball: The following table lists the heights (inches) and weights (pounds) of 14 National Football League quarterbacks in the 2016 season.

Chapter 4.2, Problem 23E, Pass the ball: The following table lists the heights (inches) and weights (pounds) of 14 National

  1. Compute the least-squares regression line for predicting weight from height.
  2. Is it possible to interpret the y-intercept? Explain.
  3. If two quarterbacks differ in height by two inches: by how much would you predict their weights to differ?
  4. Predict the of a quarterback who is 74.5 inches tall.
  5. Kirk Cousins is 75 inches tall and weighs 214 pounds. Does he weigh more or less than the weight predicted by the least-squares regression line?

a.

Expert Solution
Check Mark
To determine

To find: The least-square regression line for the given data set.

Answer to Problem 23E

The least square regression line of the given data set is,

  y^=146.766+4.9439x

Explanation of Solution

Following table with the heights and the weights of the national football quarterbacks in the season 2016 has been given.

    NameHeightWeight
    Aaron Rogers77230
    Cam Newton77244
    Russell Wilson71206
    Andrew Luck76234
    Drew Brees72209
    Blake Bortles77232
    Ben Roethlisberger77241
    Philip Rivers77228
    Eli Manning76225
    Tyrod Taylor73217
    Jamies Winston76231
    Carson Palmer77235
    Kirk Cousins75214
    Tom Brady76225

Calculation:

The least-square regression is given by the formula,

  y^=b0+b1x

Where b1=rsysx and b0=y¯b1x¯

  r is the correlation coefficient.

  sx is the standard deviation of x .

  sy is the standard deviation of y .

The correlation coefficient is given by the formula,

  r=1n1( x x ¯ s x )( y y ¯ s y )

Let x be the sales price and y be the monthly rental. Here MINITAB is used.

  ELEMENTARY STATISTICS-ALEKS ACCESS CODE, Chapter 4.2, Problem 23E

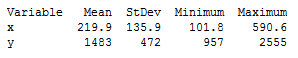
The correlation coefficient can be obtained by the following table.

  xy x x ¯ s x y y ¯ s y ( x x ¯ s x )( y y ¯ s y ) 77 230 0.7394 0.3072 0.2271 77 244 0.7394 1.5360 1.1357 71 206 2.2182 1.7993 3.9913 76 234 0.2465 0.6583 0.1622 72 209 1.7253 1.5360 2.6500 77 232 0.7394 0.4827 0.3569 77 241 0.7394 1.2727 0.9410 77 228 0.7394 0.1317 0.0973 76 225 0.2465 0.1317 0.0325 73 217 1.2324 0.8338 1.0276 76 231 0.2465 0.3950 0.0973 77 235 0.7394 0.7461 0.5516 75 214 0.2465 1.0971 0.2704 76 225 0.2465 0.1317 0.0325 ( x x ¯ s x )( y y ¯ s y )=11.4438

Hence, the correlation coefficient is,

  r=1141×11.4438=11.443813r=0.8803

Then, the coefficient b1 should be,

  b1=rsysx=0.8803×11.39332.0286b1=4.9439

Therefore,

  b0=y¯b1x¯=226.5+4.9439×75.5=226.5+725.8420b0=146.766

Conclusion:

The least square regression line is found to be,

  y^=146.766+4.9439x

b.

Expert Solution
Check Mark
To determine

To explain:The possibility to interpret the y intercept of the least-square regression line.

Answer to Problem 23E

The y intercept cannot be interpreted for the weight of the players.

Explanation of Solution

The least-square regression line has been computed as y^=146.766+4.9439x in the part (a).

Considering the x as the height and y as the weight of these 14 players, the relationship is said to be y^=146.766+4.9439x . Here the y intercept has been obtained as 146.766 . It is clear that this is a negative value.

The y intercept is defined as the y value when x is zero. Regarding this case, that y intercept is negative which means when the height of a player is zero, his weight is a negative value.

Conclusion:

There is no chance to a weight be a negative value. Therefore, this y intercept cannot be interpreted for this height-to-weight relationship.

c.

Expert Solution
Check Mark
To determine

To calculate:The difference in the weight of two players when their heights differ by two inches.

Answer to Problem 23E

The difference of weight is found to be 9.8878 pounds.

Explanation of Solution

The least-square regression line has been computed as y^=146.766+4.9439x in the part (a).

Calculation:

Let the height of the shorter payer be x0 . Then, the taller one’s height should be x0+2 . The corresponding weight of the shorter player can be obtained as,

  y^x0=146.766+4.9439x0

Also, the weight of the taller player should be,

  y^x0+2=146.766+4.9439(x0+2)

Simplifying the obtained weight,

  y^x0+2=146.766+4.9439(x0+2)=146.766+4.9439× x 0 y ^ x 0 +4.9439×2y^x0+2=y^x0+9.8878

Therefore, the difference of two weights should be,

  y^x0+2y^x0=9.8878

Interpretation:

As the calculation above, the weight difference for two inches change in the height is found to be 9.8878 pounds.

d.

Expert Solution
Check Mark
To determine

To find:The predicted weight of a player whose height is 74.5 inches.

Answer to Problem 23E

The weight of a player whose height is 74.5 inches is found to be 221.5546 pounds.

Explanation of Solution

Calculation:

By the computed least-square regression line, we can calculate the predictions for the weights of the players by substituting their heights into the formula.

Here, the height is said to be 74.5 inches. Hence, x should be 74.5 .

  y^=146.766+4.9439×74.5=146.766+368.3206y^=221.5546

Conclusion:

The weight of a player whose height is 74.5 inches is found to be 221.5546 pounds.

e.

Expert Solution
Check Mark
To determine

To find:Whether theactual weight of this player is greater than the predicted weight or not.

Answer to Problem 23E

The player weighs less than the predicted weight.

Explanation of Solution

The player is 214 pounds in weight where his height is 75 inches.

Calculation:

When the height is said to be 75 inches, the variable x should be equal to 75 . Then, by substituting x=75 into the formula of least-square regression line, we can obtain the predicted weight of the player.

  y^=146.766+4.9439×75=146.766+368.3206y^=224.0265

The predicted weight is found to be 224.0265 pounds.

Conclusion:

Since 224.0265>214 the predicted weight of the player is greater than the actual weight.

Want to see more full solutions like this?

Subscribe now to access step-by-step solutions to millions of textbook problems written by subject matter experts!

Chapter 4 Solutions

ELEMENTARY STATISTICS-ALEKS ACCESS CODE

Ch. 4.1 - In Exercises 17-20, compute the correlation...Ch. 4.1 - In Exercises 17-20, compute the correlation...Ch. 4.1 - In Exercises 21-24, determine whether the...Ch. 4.1 - In Exercises 21-24, determine whether the...Ch. 4.1 - In Exercises 21-24, determine whether the...Ch. 4.1 - In Exercises 21-24, determine whether the...Ch. 4.1 - In Exercises 25-30, determine whether the...Ch. 4.1 - In Exercises 25-30, determine whether the...Ch. 4.1 - In Exercises 25-30, determine whether the...Ch. 4.1 - In Exercises 25-30, determine whether the...Ch. 4.1 - In Exercises 25-30, determine whether the...Ch. 4.1 - In Exercises 25-30, determine whether the...Ch. 4.1 - Price of eggs and milk: The following table...Ch. 4.1 - Government funding: The following table presents...Ch. 4.1 - Pass the ball: The following table lists the...Ch. 4.1 - Carbon footprint: Carbon dioxide (CO2) is produced...Ch. 4.1 - Foot temperatures: Foot ulcers are a common...Ch. 4.1 - Mortgage payments: The following table presents...Ch. 4.1 - Blood pressure: A blood pressure measurement...Ch. 4.1 - Prob. 38ECh. 4.1 - Police and crime: In a survey of cities in the...Ch. 4.1 - Age and education: A survey of U.S. adults showed...Ch. 4.1 - Whats the correlation? In a sample of adults, the...Ch. 4.1 - Prob. 42ECh. 4.1 - Changing means and standard deviations: A small...Ch. 4.2 - In Exercises 5-7, fill in each blank with the...Ch. 4.2 - In Exercises 5-7, fill in each blank with the...Ch. 4.2 - In Exercises 5-7, fill in each blank with the...Ch. 4.2 - Prob. 8ECh. 4.2 - Prob. 9ECh. 4.2 - Prob. 10ECh. 4.2 - Prob. 11ECh. 4.2 - Prob. 12ECh. 4.2 - In Exercises 13-16, compute the least-squares...Ch. 4.2 - In Exercises 13-16, compute the least-squares...Ch. 4.2 - In Exercises 13-16, compute the least-squares...Ch. 4.2 - In Exercises 13-16, compute the least-squares...Ch. 4.2 - Compute the least-squares regression he for...Ch. 4.2 - Compute the least-squares regression he for...Ch. 4.2 - In a hypothetical study of the relationship...Ch. 4.2 - Assume in a study of educational level in years...Ch. 4.2 - Price of eggs and milk: The following table...Ch. 4.2 - Government funding: The following table presents...Ch. 4.2 - Pass the ball: The following table lists the...Ch. 4.2 - Carbon footprint: Carbon dioxide (CO2) is produced...Ch. 4.2 - Foot temperatures: Foot ulcers are a common...Ch. 4.2 - Mortgage payments: The following table presents...Ch. 4.2 - Blood pressure: A blood pressure measurement...Ch. 4.2 - Butterfly wings: Do larger butterflies live...Ch. 4.2 - Interpreting technology: The following display...Ch. 4.2 - Interpreting technology: The following display...Ch. 4.2 - Interpreting technology: The following MINITAB...Ch. 4.2 - Interpreting technology: The following MINITAB...Ch. 4.2 - Prob. 33ECh. 4.2 - Prob. 34ECh. 4.2 - Least-squares regression line for z-scores: The...Ch. 4.3 - In Exercises 5-10, fill in each blank with the...Ch. 4.3 - In Exercises 5-10, fill in each blank with the...Ch. 4.3 - In Exercises 5-10, fill in each blank with the...Ch. 4.3 - In Exercises 5-10, fill in each blank with the...Ch. 4.3 - In Exercises 5-10, fill in each blank with the...Ch. 4.3 - Prob. 10ECh. 4.3 - Prob. 11ECh. 4.3 - In Exercises 11-14, determine whether the...Ch. 4.3 - Prob. 13ECh. 4.3 - In Exercises 11-14, determine whether the...Ch. 4.3 - For the following data set: Compute the...Ch. 4.3 - For the following data set: Compute the...Ch. 4.3 - For the following data set: Compute the...Ch. 4.3 - For the following data set: Compute the...Ch. 4.3 - Prob. 19ECh. 4.3 - Prob. 20ECh. 4.3 - Prob. 21ECh. 4.3 - Prob. 22ECh. 4.3 - Hot enough for you? The following table presents...Ch. 4.3 - Presidents and first ladies: The presents the ages...Ch. 4.3 - Mutant genes: In a study to determine whether the...Ch. 4.3 - Imports and exports: The following table presents...Ch. 4.3 - Energy consumption: The following table presents...Ch. 4.3 - Cost of health care: The following table presents...Ch. 4.3 - Prob. 29ECh. 4.3 - Prob. 30ECh. 4.3 - Prob. 31ECh. 4.3 - Transforming a variable: The following table...Ch. 4.3 - Prob. 33ECh. 4.3 - Prob. 34ECh. 4 - Compute the correlation coefficient for the...Ch. 4 - The number of theaters showing the movie Monsters...Ch. 4 - Use the data in Exercise 2 to compute the...Ch. 4 - A scatterplot has a correlation of r=1. Describe...Ch. 4 - Prob. 5CQCh. 4 - Prob. 6CQCh. 4 - Use the least-squares regression line computed in...Ch. 4 - Use the least-squares regression line computed in...Ch. 4 - Prob. 9CQCh. 4 - A scatterplot has a least-squares regression line...Ch. 4 - Prob. 11CQCh. 4 - Prob. 12CQCh. 4 - A sample of students was studied to determine the...Ch. 4 - In a scatter-plot; the point (-2, 7) is...Ch. 4 - The correlation coefficient for a data set is...Ch. 4 - Prob. 1RECh. 4 - Prob. 2RECh. 4 - Hows your mileage? Weight (in tons) and fuel...Ch. 4 - Prob. 4RECh. 4 - Energy efficiency: A sample of 10 households was...Ch. 4 - Energy efficiency: Using the data in Exercise 5:...Ch. 4 - Prob. 7RECh. 4 - Prob. 8RECh. 4 - Prob. 9RECh. 4 - Prob. 10RECh. 4 - Baby weights: The average gestational age (time...Ch. 4 - Commute times: Every morning, Tania leaves for...Ch. 4 - Prob. 13RECh. 4 - Prob. 14RECh. 4 - Prob. 15RECh. 4 - Describe an example which two variables are...Ch. 4 - Two variables x and y have a positive association...Ch. 4 - Prob. 3WAICh. 4 - Prob. 4WAICh. 4 - Prob. 5WAICh. 4 - Prob. 6WAICh. 4 - Prob. 7WAICh. 4 - Prob. 8WAICh. 4 - Prob. 9WAICh. 4 - The following table, reproduced from the chapter...Ch. 4 - Prob. 2CSCh. 4 - Prob. 3CSCh. 4 - Prob. 4CSCh. 4 - Prob. 5CSCh. 4 - Prob. 6CSCh. 4 - Prob. 7CSCh. 4 - Prob. 8CSCh. 4 - Prob. 9CSCh. 4 - Prob. 10CSCh. 4 - Prob. 11CSCh. 4 - Prob. 12CSCh. 4 - Prob. 13CSCh. 4 - If we are going to use data from this year to...Ch. 4 - Prob. 15CS
Knowledge Booster
Background pattern image
Statistics
Learn more about
Need a deep-dive on the concept behind this application? Look no further. Learn more about this topic, statistics and related others by exploring similar questions and additional content below.
Recommended textbooks for you
Text book image
Linear Algebra: A Modern Introduction
Algebra
ISBN:9781285463247
Author:David Poole
Publisher:Cengage Learning
Text book image
College Algebra
Algebra
ISBN:9781337282291
Author:Ron Larson
Publisher:Cengage Learning
Text book image
Glencoe Algebra 1, Student Edition, 9780079039897...
Algebra
ISBN:9780079039897
Author:Carter
Publisher:McGraw Hill
Text book image
Big Ideas Math A Bridge To Success Algebra 1: Stu...
Algebra
ISBN:9781680331141
Author:HOUGHTON MIFFLIN HARCOURT
Publisher:Houghton Mifflin Harcourt
Text book image
Holt Mcdougal Larson Pre-algebra: Student Edition...
Algebra
ISBN:9780547587776
Author:HOLT MCDOUGAL
Publisher:HOLT MCDOUGAL
Correlation Vs Regression: Difference Between them with definition & Comparison Chart; Author: Key Differences;https://www.youtube.com/watch?v=Ou2QGSJVd0U;License: Standard YouTube License, CC-BY
Correlation and Regression: Concepts with Illustrative examples; Author: LEARN & APPLY : Lean and Six Sigma;https://www.youtube.com/watch?v=xTpHD5WLuoA;License: Standard YouTube License, CC-BY