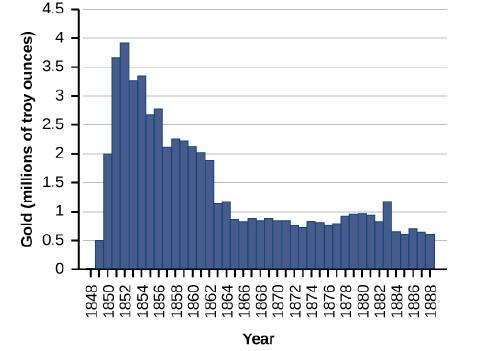
For the following exercises, consider the production of gold during the California gold rush (1848-1888). The production of gold can be modeled by G ( t ) = ( 25 t ) ( t 2 + 16 ) , where t is the number of years since the rush began ( 0 ≤ t ≤ 40 ) and G is ounces of gold produced (in millions). A summary of the data is shown in the following figure. 143. Find when the minimum (local and global) gold production occurred. What was the amount of gold produced during this minimum?
For the following exercises, consider the production of gold during the California gold rush (1848-1888). The production of gold can be modeled by G ( t ) = ( 25 t ) ( t 2 + 16 ) , where t is the number of years since the rush began ( 0 ≤ t ≤ 40 ) and G is ounces of gold produced (in millions). A summary of the data is shown in the following figure. 143. Find when the minimum (local and global) gold production occurred. What was the amount of gold produced during this minimum?
For the following exercises, consider the production of gold during the California gold rush (1848-1888). The production of gold can be modeled by
G
(
t
)
=
(
25
t
)
(
t
2
+
16
)
, where t is the number of years since the rush began
(
0
≤
t
≤
40
)
and G is ounces of gold produced (in millions). A summary of the data is shown in the following figure.
143. Find when the minimum (local and global) gold production occurred. What was the amount of gold produced during this minimum?
Using & Understanding Mathematics: A Quantitative Reasoning Approach (7th Edition)
Knowledge Booster
Learn more about
Need a deep-dive on the concept behind this application? Look no further. Learn more about this topic, subject and related others by exploring similar questions and additional content below.