
>LCPO< FUND OF STATISTICS
5th Edition
ISBN: 9781034509998
Author: Sullivan
Publisher: PEARSON
expand_more
expand_more
format_list_bulleted
Concept explainers
Videos
Textbook Question
Chapter 4.3, Problem 3AYU
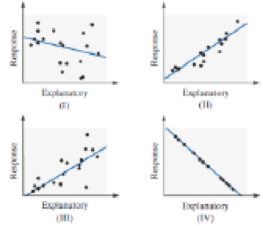
Match each coefficient of determination to a
- a. R2 = 0.58
- b. R2 = 0.90
- c. R2 = 1
- d. R2 = 0.12
Expert Solution & Answer
Want to see the full answer?
Check out a sample textbook solution
Students have asked these similar questions
The largest percentage of the students received what grade
A lecturer selected 300 students in the college and classified the results of Business Statistics
according to gender and level of results. Test whether the level of results is independent of the
gender. Use a = 0.01.
b)
Level of result
Gender
Fail
Pass
Good
Female
Male
90
70
35
40
15
50
Choose the letter of the correct answer from the box below.
Chapter 4 Solutions
>LCPO< FUND OF STATISTICS
Ch. 4.1 - What is the difference between univariate data and...Ch. 4.1 - The _____ variable is the variable whose value can...Ch. 4.1 - A _____ _____ is a graph that shows the relation...Ch. 4.1 - What does it mean to say two variables are...Ch. 4.1 - If r = _____, then a perfect negative linear...Ch. 4.1 - True or False: If the linear correlation...Ch. 4.1 - A _____ variable is a variable that is related to...Ch. 4.1 - True or False: Correlation implies causation.Ch. 4.1 - In Problems 912, determine whether the scatter...Ch. 4.1 - In Problems 912, determine whether the scatter...
Ch. 4.1 - In Problems 912, determine whether the scatter...Ch. 4.1 - In Problems 912, determine whether the scatter...Ch. 4.1 - NW Match the linear correlation coefficient to the...Ch. 4.1 - Match the linear correlation coefficient to the...Ch. 4.1 - Prob. 15AYUCh. 4.1 - Relation between Education and Birthrate? The...Ch. 4.1 - In Problems 1720, (a) draw a scatter diagram of...Ch. 4.1 - In Problems 1720, (a) draw a scatter diagram of...Ch. 4.1 - In Problems 1720, (a) draw a scatter diagram of...Ch. 4.1 - In Problems 1720, (a) draw a scatter diagram of...Ch. 4.1 - Name the Relation, Part I For each of the...Ch. 4.1 - Prob. 22AYUCh. 4.1 - The TIMMS Exam The Trends in International...Ch. 4.1 - Prob. 24AYUCh. 4.1 - NW An Unhealthy Commute The Gallup Organization...Ch. 4.1 - Credit Scores Your Fair Isaacs Corporation (FICO)...Ch. 4.1 - Height versus Head Circumference A pediatrician...Ch. 4.1 - American Black Bears The American black bear...Ch. 4.1 - Weight of a Car versus Miles per Gallon An...Ch. 4.1 - Hurricanes The data in the next column represent...Ch. 4.1 - CEO Performance The following data represent the...Ch. 4.1 - Bear Markets A bear market in the stock market is...Ch. 4.1 - Does Size Matter? Researchers wondered whether the...Ch. 4.1 - Prob. 34AYUCh. 4.1 - Weight of a Car versus Miles per Gallon Suppose...Ch. 4.1 - American Black Bears The website that contained...Ch. 4.1 - Draw Your Data! Consider the four data sets shown...Ch. 4.1 - Predicting Winning Percentage The ultimate goal in...Ch. 4.1 - Prob. 39AYUCh. 4.1 - Lyme Disease versus Drownings Lyme disease is an...Ch. 4.1 - Prob. 41AYUCh. 4.1 - Prob. 42AYUCh. 4.1 - Crime Rate and Cell Phones The linear correlation...Ch. 4.1 - Prob. 44AYUCh. 4.1 - Influential Consider the following set of data: a....Ch. 4.1 - Prob. 46AYUCh. 4.1 - Prob. 47AYUCh. 4.1 - Prob. 48AYUCh. 4.1 - What does it mean to say that the linear...Ch. 4.1 - What does it mean if r = 0?Ch. 4.1 - Prob. 51AYUCh. 4.1 - Prob. 52AYUCh. 4.1 - Explain the difference between correlation and...Ch. 4.1 - Suppose that two variables, x and y, are...Ch. 4.2 - The difference between the observed and predicted...Ch. 4.2 - If the linear correlation between two variables is...Ch. 4.2 - Prob. 3AYUCh. 4.2 - Prob. 4AYUCh. 4.2 - For the data set a. Draw a scatter diagram....Ch. 4.2 - For the data set a. Draw a scatter diagram....Ch. 4.2 - In Problems 712: a. By hand, draw a scatter...Ch. 4.2 - In Problems 712: a. By hand, draw a scatter...Ch. 4.2 - Prob. 9AYUCh. 4.2 - In Problems 712: a. By hand, draw a scatter...Ch. 4.2 - In Problems 712: a. By hand, draw a scatter...Ch. 4.2 - In Problems 712: a. By hand, draw a scatter...Ch. 4.2 - NW Income and Education In Problem 15 from Section...Ch. 4.2 - You Explain It! Study Time and Exam Scores After...Ch. 4.2 - Age Gap at Marriage Is there a relation between...Ch. 4.2 - You Explain It! CO2 and Energy Production The...Ch. 4.2 - NW An Unhealthy Commute (Refer to Problem 25,...Ch. 4.2 - Credit Scores (Refer to Problem 26, Section 4.1.)...Ch. 4.2 - Height versus Head Circumference (Refer to Problem...Ch. 4.2 - Prob. 20AYUCh. 4.2 - Weight of a Car versus Miles per Gallon (Refer to...Ch. 4.2 - Hurricanes (Refer to Problem 30, Section 4.1) The...Ch. 4.2 - Cola Consumption vs. Bone Density Example 5 in...Ch. 4.2 - Attending Class The following data represent the...Ch. 4.2 - CEO Performance (Refer to Problem 31 in Section...Ch. 4.2 - Bear Markets (Refer to Problem 32, Section 4.1) A...Ch. 4.2 - Male vs. Female Drivers (Refer to Problem 34,...Ch. 4.2 - Graduation Rates Go to...Ch. 4.2 - Putting It Together: Housing Prices One of the...Ch. 4.2 - Putting It Together: Smoking and Birth Weight It...Ch. 4.2 - What is a residual? What does it mean when a...Ch. 4.2 - Explain the phrase outside the scope of the model....Ch. 4.2 - Explain what each point on the least-squares...Ch. 4.3 - The _____ _____ _____, R2, measures the proportion...Ch. 4.3 - Total deviation = _____ deviation + _____...Ch. 4.3 - Match each coefficient of determination to a...Ch. 4.3 - NW The Other Old Faithful Perhaps you are familiar...Ch. 4.3 - Concrete As concrete cures, it gains strength. The...Ch. 4.3 - Prob. 7AYUCh. 4.3 - Problems 712 use the results from Problems 2530 in...Ch. 4.3 - Prob. 9AYUCh. 4.3 - Problems 712 use the results from Problems 2530 in...Ch. 4.3 - Problems 712 use the results from Problems 2530 in...Ch. 4.3 - Prob. 12AYUCh. 4.3 - Weight of a Car versus Miles per Gallon Suppose...Ch. 4.3 - American Black Bears Suppose that we find a bear...Ch. 4.3 - Putting It Together: Exam Scores The data below...Ch. 4.3 - Sullivan Survey II Go to...Ch. 4.4 - What is meant by a marginal distribution? What is...Ch. 4.4 - Refer to Table 8. Is constructing a conditional...Ch. 4.4 - Prob. 3AYUCh. 4.4 - Explain the idea behind Simpsons Paradox.Ch. 4.4 - In Problems 5 and 6, a. Construct a frequency...Ch. 4.4 - In Problems 5 and 6, a. Construct a frequency...Ch. 4.4 - Made in America In a recent Harris Poll, a random...Ch. 4.4 - Desirability Traits In a recent Harris Poll, a...Ch. 4.4 - NW Party Affiliation Is there an association...Ch. 4.4 - Prob. 10AYUCh. 4.4 - Health and Happiness The General Social Survey...Ch. 4.4 - Happy in Your Marriage? The General Social Survey...Ch. 4.4 - Prob. 13AYUCh. 4.4 - Treating Kidney Stones Researchers conducted a...Ch. 4.4 - Sullivan Survey II Go to...Ch. 4 - Basketball Spreads In sports betting, Las Vegas...Ch. 4 - Fat and Calories in Cheeseburgers A nutritionist...Ch. 4 - Prob. 3RECh. 4 - Prob. 4RECh. 4 - Prob. 5RECh. 4 - a. Draw a scatter diagram treating x as the...Ch. 4 - Use the results from Problems 2 and 4 to compute...Ch. 4 - Prob. 8RECh. 4 - Prob. 9RECh. 4 - New versus Used Car Satisfaction Are you more...Ch. 4 - Unemployment Rates Recessions are an economic...Ch. 4 - Prob. 12RECh. 4 - Prob. 13RECh. 4 - Prob. 1CTCh. 4 - Use the data from Problem 1. a. Find the...Ch. 4 - Use the results from Problems 1 and 2 to compute...Ch. 4 - The following data represent the speed of a car...Ch. 4 - Prob. 5CTCh. 4 - Prob. 6CTCh. 4 - Consider the following contingency table, which...Ch. 4 - What would you say about a set of quantitative...Ch. 4 - If the slope of a least-squares regression line is...Ch. 4 - What does it mean if a linear correlation...
Knowledge Booster


Learn more about
Need a deep-dive on the concept behind this application? Look no further. Learn more about this topic, statistics and related others by exploring similar questions and additional content below.Similar questions
- Statistics Questionarrow_forwardMatch these values of r with the accompanying scatterplots: 0.42, - 0.781, -1, 1, and 0.995. Click the icon to view the scatterplots. i Scatterplots Match the values of r to the scatterplots. Scatterplot 1, r= Scatterplot 1 Scatterplot 2 Scatterplot 3 Scatterplot 2, r = Scatterplot 3, r= 15- 8- 8- 14- 6- Scatterplot 4, r = 6- 13- > 4- Scatterplot 5, r= 4- 12- 11- 24 2- 10+ 0+ 0.2 0.4 0.6 0.8 1 0.2 0.4 0.6 0.8 1 0.2 0.4 0.6 0.8 1 Scatterplot 4 Scatterplot 5 0- 8- -1- 6- > -2- 4- -3- 2- :. -4- 0- 0.2 0.4 0.6 0.8 1 0.2 0.4 0.6 0.8 1 X of •. ofarrow_forward
arrow_back_ios
arrow_forward_ios
Recommended textbooks for you
 Mathematics For Machine TechnologyAdvanced MathISBN:9781337798310Author:Peterson, John.Publisher:Cengage Learning,
 Holt Mcdougal Larson Pre-algebra: Student Edition...AlgebraISBN:9780547587776Author:HOLT MCDOUGALPublisher:HOLT MCDOUGAL
 Elementary AlgebraAlgebraISBN:9780998625713Author:Lynn Marecek, MaryAnne Anthony-SmithPublisher:OpenStax - Rice University
 Glencoe Algebra 1, Student Edition, 9780079039897...AlgebraISBN:9780079039897Author:CarterPublisher:McGraw Hill
 Algebra: Structure And Method, Book 1AlgebraISBN:9780395977224Author:Richard G. Brown, Mary P. Dolciani, Robert H. Sorgenfrey, William L. ColePublisher:McDougal Littell
Mathematics For Machine Technology
Advanced Math
ISBN:9781337798310
Author:Peterson, John.
Publisher:Cengage Learning,
Holt Mcdougal Larson Pre-algebra: Student Edition...
Algebra
ISBN:9780547587776
Author:HOLT MCDOUGAL
Publisher:HOLT MCDOUGAL
Elementary Algebra
Algebra
ISBN:9780998625713
Author:Lynn Marecek, MaryAnne Anthony-Smith
Publisher:OpenStax - Rice University
Glencoe Algebra 1, Student Edition, 9780079039897...
Algebra
ISBN:9780079039897
Author:Carter
Publisher:McGraw Hill
Algebra: Structure And Method, Book 1
Algebra
ISBN:9780395977224
Author:Richard G. Brown, Mary P. Dolciani, Robert H. Sorgenfrey, William L. Cole
Publisher:McDougal Littell
Area Between The Curve Problem No 1 - Applications Of Definite Integration - Diploma Maths II; Author: Ekeeda;https://www.youtube.com/watch?v=q3ZU0GnGaxA;License: Standard YouTube License, CC-BY