Concept explainers
Videos
Height of a Plant Let
(weeks ).
a. When is the plant
b. When is the plant growing at the rate of
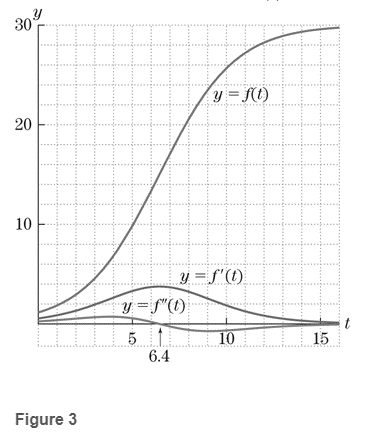
c. What is the fastest rate of growth of the plant, and when does this occur?
Exercise 39. Heights of a Plant The height of a certain plant, in inches, after
The graph of
Want to see the full answer?
Check out a sample textbook solution
Chapter 4 Solutions
Student Solutions Manual for Calculus & Its Applications and Calculus & Its Applications, Brief Version


- Growth in Weight and Height Between the ages of 7 and 11 years, the weight w, in pounds, of a certain girl is given by the formula w=8t. Here t represents her age in years. a. Use a formula to express the age t of the girl as a function of her weight w. b. At what age does she attain a weight of 68 pounds? c. The height h, in inches, of this girl during the same period is given by the formula h=1.8t+40. i. Use you answer to part b to determine how tall she is when she weighs 68 pounds. ii. Use a formula to express the height h of the girl as a function of her weight w. iii. Answer the question in part i again, this time using your answer to part ii.arrow_forwardPopulation Growth The projected population of the United States for the years 2025 through 2055 can be modeled by P=307.58e0.0052t, where P is the population (in millions) and t is the time (in years), with t=25 corresponding to 2025. (a) Use a graphing utility to graph the function for the years 2025 through 2055. (b) Use the table feature of the graphing utility to create a table of values for the same time period as in part (a). (c) According to the model, during what year will the population of the United States exceed 430 million?arrow_forwardSales Growth In this exercise, we develop a model for the growth rate G, in thousands of dollars per year, in sales of the product as a function of the sales level s, in thousands of dollars. The model assumes that there is a limit to the total amount of sales that can be attained. In this situation, we use the term unattained sales for difference this limit and the current sales level. For example, if we expect sales grow to 3 thousand dollars in the long run, then 3-s is the unattained sales. The model states that the growth rate G is proportional to the product of the sales level s, and the unattained sales. Assume that the constant of proportionality is 0.3 and that the sales grow to 2 thousand dollars in the long run. a.Find the formula for unattained sales. b.Write an equation that shows the proportionality relation for G. c.On the basis of the equation from the part b, make a graph of G as a function of s. d.At what sales level is the growth rate as large as possible? e.What is the largest possible growth rate?arrow_forward
- Population Growth The projected population of the United States for the years 2025 through 2055 can be modeled by P=307.58e0.0052t, where P is the population (in millions) and t is the time (in years), with t=25 corresponding to 2025. (Source: U.S. Census Bureau) (a) Use a graphing utility to graph the function for the years 2025 through 2055. (b) Use the table feature of the graphing utility to create a table of values for the same time period as in part (a). (c) According to the model, during what year will the population of the United States exceed 430 million?arrow_forwardAverage Speed: A commuter regularly drives 70 miles from home to work, and the amount of time required for the trip varies widely as a result of road and traffic conditions. The average speed for such a trip is a function of the time required. For example, if the trip takes 2 hours, then the average speed is 70/2 = 35 miles per hour. a. What is the average speed if the trip takes an hour and a half? b. Find a formula for the average speed as a function of the time required for the trip. You need to choose variable and function names. Be sure to state units. c. Make a graph of the average speed as a function of the time required. Includes trips from 1 hour to 3 hours in length. d. Is the graph concave up or concave down? Explain in practical terms what this meansarrow_forwardSpawner-Recruit Model In fish management it is important to know the relationship between the abundance of the spawners also called the parent stock and the abundance of the recruitsthat is, those hatchlings surviving to maturity. According to the Ricker model, the number of recruits R as a function of the number of spawners P has the form R=APeBp for some positive constants A and B. This model describes well a phenomenon observed in some fisheries: A large spawning group can actually lead to a small group of recruits. In a study of the sockeye salmon, it was determined that A=4 and B=0.7. Here we measure P and R in thousands of salmon. a. Make a graph of R versus P for the sockeye salmon. Assume there are at most 3000 spawners. b. Find the maximum number of salmon recruits possible. c. If the number of recruits R is greater than the number of spawners P, then the difference R-P of the recruits can be removed by fishing, and next season there will once again be P spawners surviving to renew the cycle. What value of P gives the maximum value of R-P, the number of fish available for removal by fishing?arrow_forward
- Arboriculture The growth of a red oak tree is approximated by the function G=0.003t3+0.137t2+0.458t0.839,2t34 where G is the height of the tree (in feet) and t is its age (in years). (a) Use a graphing utility to graph the function. (b) Estimate the age of the tree when it is growing most rapidly. This point is called the point of diminishing returns because the increase in size will be less with each additional year. (c) Using calculus, the point of diminishing returns can be found by finding the vertex of the parabola y=0.009t2+0.274t+0.458. Find the vertex of this parabola. (d) Compare your results from parts (b) and (c).arrow_forwardResale Value: The resale value V, in dollars, of a certain car is a function of the number of year t since the year 2012. In the year 2012, the resale ale is 18,000 and each year thereafter the resale value decreases by 1700. a. What is the resale value in the year 2013? b. Find a formula for V as a function of t. c. Make a graph of V versus t covering the first 4 years since the year 2012. d. Use functional notation to express the resale value in the year 2015, and then calculate that value.arrow_forwardDecay of Litter Litter such as leaves falls to the forest floor, where the action of insects and bacteria initiates the decay process. Let A be the amount of litter present, in grams per square meter, as a function of time t in years. If the litter falls at a constant rate of L grams per square meter per year, and if it decays at a constant proportional rate of k per year, then the limiting value of A is R=L/k. For this exercise and the next, we suppose that at time t=0, the forest floor is clear of litter. a. If D is the difference between the limiting value and A, so that D=RA, then D is an exponential function of time. Find the initial value of D in terms of R. b. The yearly decay factor for D is ek. Find a formula for D in term of R and k. Reminder:(ab)c=abc. c. Explain why A=RRekt.arrow_forward
 Functions and Change: A Modeling Approach to Coll...AlgebraISBN:9781337111348Author:Bruce Crauder, Benny Evans, Alan NoellPublisher:Cengage Learning
 Algebra & Trigonometry with Analytic GeometryAlgebraISBN:9781133382119Author:SwokowskiPublisher:Cengage
 College AlgebraAlgebraISBN:9781305115545Author:James Stewart, Lothar Redlin, Saleem WatsonPublisher:Cengage Learning
 Algebra and Trigonometry (MindTap Course List)AlgebraISBN:9781305071742Author:James Stewart, Lothar Redlin, Saleem WatsonPublisher:Cengage Learning
 Trigonometry (MindTap Course List)TrigonometryISBN:9781337278461Author:Ron LarsonPublisher:Cengage Learning