
Concept explainers
Videos
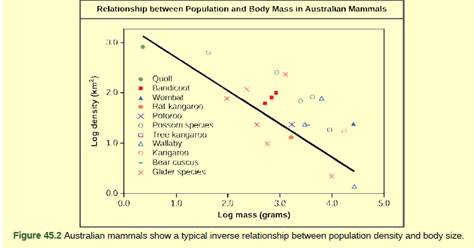
Figure 45.2 As this graph shows, population density typically decreases with increasing body size. Why do you think this is the case?
To analyze:
The reason for the decrease in the population density with increasing body size.
Introduction:
Population refers to the all the inhabitants of a particular place which include the communities of plants, animals, and humans among whose members interbreeding occurs. Population fluctuates based on a number of factors. The statistical study of the population dynamics is called the demography.
Explanation of Solution
Population is characterized by its population size (N) and its population density. Population size refers to the total number of individuals whereas, population density is the number of individuals within a particular area. Smaller animals require less food and other resources for their survival. This leads to less competition among the resources and the environment supports smaller animals. With the increasing body size, the food and other requirements also increase in the specific area leading to the decrease in the number of individuals within the area and thus decrease in the population density.
Thus, the growing needs of the population showing increasing body size affect the population density due to the decrease of the resources in the particular area.
Want to see more full solutions like this?
Chapter 45 Solutions
Biology 2e
Additional Science Textbook Solutions
College Physics
Biological Science
Concepts of Genetics (12th Edition)
Human Anatomy & Physiology
Genetic Analysis: An Integrated Approach (3rd Edition)
Campbell Essential Biology (6th Edition) - standalone book


- Figure 45.16 Age structure diagrams for rapidly growing, slow growing, and stable populations are shown in stages 1 through 3. What type of population change do you think stage 4 represents?arrow_forwardIn a graph of population size versus time, a J-shaped curve is characteristic of (a) exponential population growth (b) logistic population growth (c) zero population growth (d) replacement-level fertility (e) population growth momentumarrow_forwardSince K = 0.5, the population we are studying is experiencing ________ growth due to density _______ factors. exponential; dependent exponential; independent logistic; dependent logistic; independentarrow_forward
- What factors led to the dramatic decrease in population growth rates in Kerala, India?Compare the case of Kerala to India’s national population control program put intoplace in the 1970s.arrow_forwardWhich of the following is a factor that would decrease the size of a population? A. Death rate is higher than the birth rate B. Abundant food supply C. Immigration D. Birth rate is higher than the death ratearrow_forwardWhich statement about population growth is true? A. Population growth models do not apply to humans. B. Population growth can be exponential for only as long as environmental conditions are favorable. C. Population growth can continue indefinitely. D. Population growth of field samples always has a λ of approximately 1.arrow_forward
- If population growth is assumed to be density dependent in all four populations, what will happen to these populations sometime after generation 10? 1. Population size will grow monotonically. 2. Rate of population growth will decrease. 3. Rate of population growth will remain the same. 4. All populations will follow the curve of populationarrow_forwardYou start a lab colony of Rotifers (small aquatic animals) by adding 5 indviduals to a small tank. One week later the population has grown to 17. Assuming that the population is growing exponentially, how many rotifers can you expect after 7 weeks? Round your answer to the closest full number.arrow_forwardWhich of the following is a density-independent factor limiting population growth in humans? fatal genetic diseases temperature competition for food fatal contagious diseasesarrow_forward
- If a population eventually reached the point where it no longer changed in size, which of the below must be true? Group of answer choices K > R0 N = K R0 = K/N r = K N > Karrow_forwardAt which point (population size and time in months) is the population growth the fastest? (Format your answer following this example: N = 10 individuals, t = 12 months).arrow_forwardThe discrete logistic function (the one you can solve with your calculator) has a time lag built in = one generation. What would a greater time lag do to the outcome? increase the chances of population exceeding K decrease the chances of population exceeding K slow down population growth by decreasing r increase population growth by increasing r it would have little/no effect under all circumstancesarrow_forward
 Concepts of BiologyBiologyISBN:9781938168116Author:Samantha Fowler, Rebecca Roush, James WisePublisher:OpenStax CollegeBiology 2eBiologyISBN:9781947172517Author:Matthew Douglas, Jung Choi, Mary Ann ClarkPublisher:OpenStax
 Biology Today and Tomorrow without Physiology (Mi...BiologyISBN:9781305117396Author:Cecie Starr, Christine Evers, Lisa StarrPublisher:Cengage Learning
 Biology (MindTap Course List)BiologyISBN:9781337392938Author:Eldra Solomon, Charles Martin, Diana W. Martin, Linda R. BergPublisher:Cengage Learning