
Concept explainers
Videos
(a)
To find: The equation of the line of best fit and
(a)
Answer to Problem 31E
The equation of the line of best fit is
The correlation coefficient is
Explanation of Solution
Given:
| Year, x | |||||
| Text messages (billions), y |
Calculation:
Consider the table shows the numbers
To use the linear regression feature of the
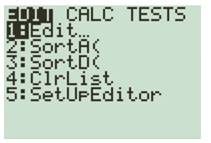
Now press the
Now to calculate the linear regression, that is
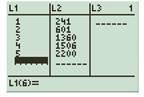
In order to input the list to use while finding the linear regression, press
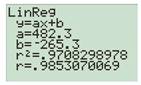
Therefore, the equation of the line of best fit is
To make the graph using graphing calculator, press the
The graph obtained is shown below
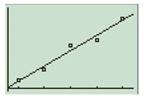
Therefore, the equation of the line of best fit is
The correlation coefficient is
Conclusion:
The equation of the line of best fit is
The correlation coefficient is
(b)
To find: The casual relationship
(b)
Answer to Problem 31E
There is no causal relationship between year and the number of text messages
Explanation of Solution
Given:
| Year, x | |||||
| Text messages (billions), y |
Calculation:
There may be no causal relationship between year and the number of text messages
Conclusion:
There may be no causal relationship between year and the number of text messages
(c)
To find: The residuals of the data set and to plot the graph
(c)
Answer to Problem 31E
There is no correlation
Explanation of Solution
Given:
| Year, x | |||||
| Text messages (billions), y |
Calculation:
Consider the equation and the data set
Find the residuals for the data set
| Year, x | Text messages (billions), y | Y-value from model | residuals |
Now plot the graph for the data set with residuals
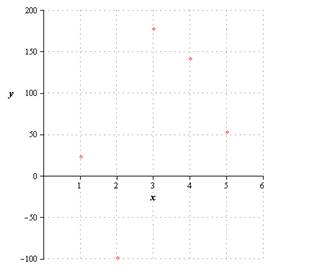
From the graph, there is no correlation
Conclusion:
There is no correlation
(d)
To find: whether the model is a good fit
(d)
Answer to Problem 31E
The graphical calculation using linear regression feature is most preferable as the accuracy is more and good model to use.
Explanation of Solution
Given:
| Year, x | |||||
| Text messages (billions), y |
Calculation:
Compare the two - graphical calculation and the residual methods
As the result is differed to each other, the graphical calculation using linear regression feature is most preferable as the accuracy is more and good model to use.
Conclusion:
The graphical calculation using linear regression feature is most preferable as the accuracy is more and good model to use.
Chapter 4 Solutions
BIG IDEAS MATH Integrated Math 1: Student Edition 2016


 Discrete Mathematics and Its Applications ( 8th I...MathISBN:9781259676512Author:Kenneth H RosenPublisher:McGraw-Hill Education
 Mathematics for Elementary Teachers with Activiti...MathISBN:9780134392790Author:Beckmann, SybillaPublisher:PEARSON
 Thinking Mathematically (7th Edition)MathISBN:9780134683713Author:Robert F. BlitzerPublisher:PEARSON
 Discrete Mathematics With ApplicationsMathISBN:9781337694193Author:EPP, Susanna S.Publisher:Cengage Learning,
 Pathways To Math Literacy (looseleaf)MathISBN:9781259985607Author:David Sobecki Professor, Brian A. MercerPublisher:McGraw-Hill Education