Concept explainers
Videos
a
To draw: The ordered pairs as
a
Answer to Problem 7PPS
Points are graphed below.
Explanation of Solution
Given Information: Table containing relevant data.
Graph:
Ordered pairs are:
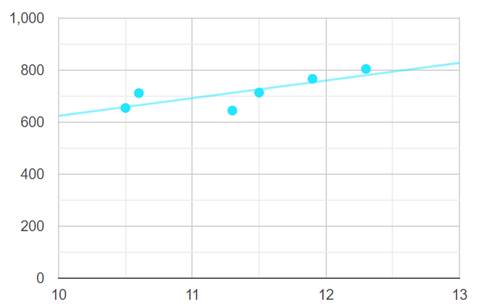
Thus, points are graphed.
b
To find: The
b
Answer to Problem 7PPS
There is a
Explanation of Solution
Given Information: Table containing relevant data.
As one moves along the horizontal axis points are going higher and higher, they are making an uphill if a line of best fit is plotted. This implies a positive correlation.
Thus, there is a positive correlation.
c
To find: The given data illustrated causation.
c
Answer to Problem 7PPS
No, data does not illustrate causation.
Explanation of Solution
Given Information: Table containing relevant data.
The number of civil engineering doctoral degrees awarded in the US over several years is not related in any sense to the per capita consumption of mozzarella cheese.
Thus, data does not illustrate causation.
Chapter 4 Solutions
Algebra 1, Homework Practice Workbook (MERRILL ALGEBRA 1)
Additional Math Textbook Solutions
Linear Algebra and Its Applications (5th Edition)
College Algebra (7th Edition)
College Algebra


 Algebra and Trigonometry (6th Edition)AlgebraISBN:9780134463216Author:Robert F. BlitzerPublisher:PEARSON
 Contemporary Abstract AlgebraAlgebraISBN:9781305657960Author:Joseph GallianPublisher:Cengage Learning
 Linear Algebra: A Modern IntroductionAlgebraISBN:9781285463247Author:David PoolePublisher:Cengage Learning
 Algebra And Trigonometry (11th Edition)AlgebraISBN:9780135163078Author:Michael SullivanPublisher:PEARSON
 Introduction to Linear Algebra, Fifth EditionAlgebraISBN:9780980232776Author:Gilbert StrangPublisher:Wellesley-Cambridge Press
 College Algebra (Collegiate Math)AlgebraISBN:9780077836344Author:Julie Miller, Donna GerkenPublisher:McGraw-Hill Education