
Concept explainers
Videos
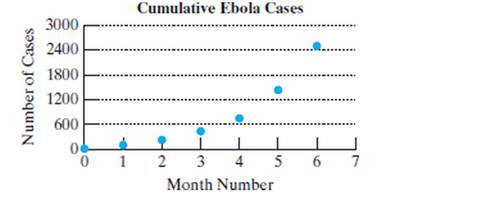
During a recent outbreak of Ebola in western Africa, the cumulative number of cases y was reported! months after April 1. (See Example 7)
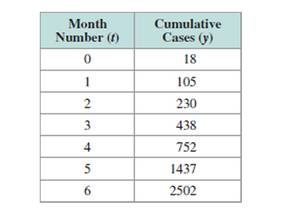
a. Use a graphing utility to find a model of the form
b. Write the function from part (a) as an exponential function of the form
c. Use either model to predict the number of Ebola cases 8 months after April 1 if this trend continues. Round to the nearest thousand.
d. Would it seem reasonable for this trend to continue indefinitely?
e. Use a graphing utility to find a logistic model
f. Use the logistic model from part (e) to predict the number of Ebola cases 8 months after April 1. Round to the nearest thousand.
Want to see the full answer?
Check out a sample textbook solution
Chapter 4 Solutions
COLL ALG & TRIG LOOSELEAF W/ALEKS ACCESS


- Enter the data from Table 2 into a graphing calculator and graph the ranking scatter plot. Determine whetherthe data from the table would likely represent a function that is linear, exponential, or logarithmic.arrow_forwardDoes a linear, exponential, or logarithmic model best fit the data in Table 2? Find the model.arrow_forwardWhat might a scatterplot of data points look like if it were best described by a logarithmic model?arrow_forward
- Table 6 shows the year and the number ofpeople unemployed in a particular city for several years. Determine whether the trend appears linear. If so, and assuming the trend continues, in what year will the number of unemployed reach 5 people?arrow_forwardExplain why the values of an increasing exponentialfunction will eventually overtake the valuesof anincreasing linear function.arrow_forwardUse a graphing calculator to solve each problem. In Example 4, suppose that a birth control program changed the formula for poulation growth to Pt=1000e0.01t. How long will the food supply be adequate? EXAMPLE 4 Using a Graphing Calculator to Solve a popuiation Problem Suppose that a country with a population of 1000 people is growing exponentially according to the population function Pt=1000e0.02t Where t in years. Furthermore, assume that the food supply, measured in adequate food per day per person, is growing linearly according to the function fx=30.625x+2000 In how many years will the population outstrip the food supply?arrow_forward
- Maria, a biologist is observing the growth pattern of a virus. She starts with 100 of the virus that grows at a rate of 10% per hour. She will check on the virus in 24 hours. How many viruses will she find?arrow_forwardThe U.S. Census tracks the percentage of persons 25 years or older who are college graduates. That data forseveral years is given in Table 4[14]. Determine whether the trend appears linear. If so, and assuming the trendcontinues. in what year will the percentage exceed 35%?arrow_forwardIs carbon dating? Why does it work? Give an example in which carbon dating would be useful.arrow_forward
- What role does the horizontal asymptote of anexponential function play in telling us about the endbehavior of the graph?arrow_forwardTable 3 gives the annual sales (in millions of dollars) of a product from 1998 to 20006. What was the average rate of change of annual sales (a) between 2001 and 2002, and (b) between 2001 and 2004?arrow_forwardWith what kind of exponential model would half-life be associated? What role does half-life play in these models?arrow_forward

 College Algebra (MindTap Course List)AlgebraISBN:9781305652231Author:R. David Gustafson, Jeff HughesPublisher:Cengage Learning
 Glencoe Algebra 1, Student Edition, 9780079039897...AlgebraISBN:9780079039897Author:CarterPublisher:McGraw Hill
 Algebra & Trigonometry with Analytic GeometryAlgebraISBN:9781133382119Author:SwokowskiPublisher:Cengage
 Big Ideas Math A Bridge To Success Algebra 1: Stu...AlgebraISBN:9781680331141Author:HOUGHTON MIFFLIN HARCOURTPublisher:Houghton Mifflin Harcourt