
Concept explainers
Videos
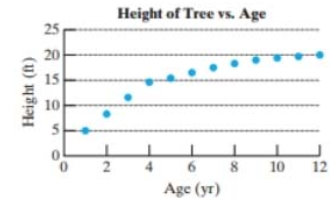
The age of a tree t (in yr) and its corresponding height
| Age of Tree (yr) t | Height (ft)
|
|---|---|
| 1 | 5 |
| 2 | 8.3 |
| 3 | 11.6 |
| 4 | 14.6 |
| 5 | 15.4 |
| 6 | 16.5 |
| 7 | 17.5 |
| 8 | 18.3 |
| 9 | 19 |
| 10 | 19.4 |
| 11 | 19.7 |
| 12 | 20 |
a. Write a model of the form
b. Use the model to predict the age of a tree if it is 25 ft high. Round to nearest year.
c. Is it reasonable to assume that this logarithmic trend will continue indefinitely? Why or why not?
Want to see the full answer?
Check out a sample textbook solution
Chapter 4 Solutions
COLLEGE ALEGEBRA W/ SUPPORT COMBO
Additional Math Textbook Solutions
Elementary Algebra
Differential Equations and Linear Algebra (4th Edition)
Algebra 1, Homework Practice Workbook (MERRILL ALGEBRA 1)
Intermediate Algebra
College Algebra (7th Edition)
Intermediate Algebra (13th Edition)


- World Crude Oil Production In 1956, M.King Hubbert proposed a model to analyse crude oil production. His model, with updated data, gives world crude oil production as P=254.43e0.042t(1+2.12e0.042t)2 Here P is measured in billions of barrels per year, and t is time, in year, since 2000. a.Make a graph of world crude oil production for 2000 through 2040. b.When does this model predict a peak in world crude oil production? c.What is the maximum crude oil production predicted by this model?arrow_forwardElephants and hippos We removed humans from thescatterplot in Exercise 31 because our species was anoutlier in life expectancy. The resulting scatterplot showstwo points that now may be of concern. The point in theupper right corner of this scatterplot is for elephants, andthe other point at the far right is for hippos.a) By removing one of these points, we could makethe association appear to be stronger. Which point?Explain.b) Would the slope of the line increase or decrease?c) Should we just keep removing animals to increase thestrength of the model? Explain.d) If we remove elephants from the scatterplot, the slopeof the regression line becomes 11.6 days per year. Doyou think elephants were an influential point? Explain.arrow_forwardA company has three retail stores located at points (0, 0), (2, 2), and (-2, 2) (see the figure). Management plans to build a distribution center located in such a way that the sum S of the distances from the center to the stores is minimal. From the symmetry of the problem it is clear that the distribution center will be located on the y-axis, and therefore S is a function of a variable y. Using the techniques presented in Chapter 3, calculate the required y value.arrow_forward
- Commercial apple trees usually consist of two parts grafted together. The upper part, or graft, determines the character of the fruit, while the root stock determines the size of the tree.† The following data are from two root stocks, A and B. The data represent total extension growth (in meters) of the grafts after 4 years. Stock A 2.52 2.26 2.86 2.91 2.78 2.58 1.96 2.10 3.41 2.94 2.88 Stock B 2.81 3.02 1.94 2.37 3.11 2.71 2.74 2.44 2.13 1.58 2.77 Use a 1% level of significance and the rank-sum test to test the claim that the distributions of growths are different for root stocks A and B. Interpret the results.What is the level of significance? Compute the sample test statistic. (Round your answer to two decimal places.) Find the P-value of the sample test statistic. (Round your answer to four decimal places.)arrow_forwardTraffic on a one way road follows a rate λ Poisson process (this means that cars arrive with rate λ per minute). A turtle needs c minutes to cross the road, so she will need a gap of at least c minutes to cross. Suppose that the turtle can see far ahead, so she can decide whether it is safe to cross the road or not. Let R denote the time the turtle spends waiting by the road after her arrival before starting to cross the road. Find E[R].arrow_forwardA mail-order computer business has six telephone lines. Let X denote the number of lines in use at a specified time. Suppose the pmf of X is as given in the accompanying table. x 0 1 2 3 4 5 6 p(x) 0.12 0.18 0.20 0.20 0.20 0.06 0.04 a.) Calculate the cdf F(x) b.) Graph the cdf F(x). (d) {between two and five lines, inclusive, are in use}arrow_forward
- The Wilcoxon paired signed ranks test a. Is used with a correlated groups design b. Uses both the magnitude and direction of the data c. All of the answers d. Is used with data that is ordinal In scalingarrow_forwardA pentagon is formed with an isosceles triangle and a rectangle, as illustrated in the figure. The pentagon has a fixed perimeter P. Using the Lagrange multipliers method, determine, as a function of P, the lengths of the sides of the pentagon that maximize the area of the figure.arrow_forward1. A researcher observed a rat respond for a food reward by pressing one of the three levers in a cage. Pressing the lever to the right (R) produced no food reward. pressing the lever to the left (L) produced a single food pellet, and pressing the lever at the center (C) produced two food pellets. Because the center level produced the largest reward, the researcher hypothesized that the rat would press this lever most often. Each trial ended when the rat produced a level. The researcher recorded lever pressing for 30 trials. L, L, R, L, R, C, R, L, C, L, L, C, C, C, R, C, R, C, L, C, C, L, C, C, C, L, C, C, C, C, C - Create the appropiate graph for this data - Do these data support the hypothesis? Explain. 2. Which scales of measurement are assumed to be discrete? What does this mean? Which scales of measurement are assumed to be continuous? What does this mean? 3. What type of graph should you create to visualize the following frequency data? Explain. -…arrow_forward
- In the model of Exercise 12, let A(t) be the area at time t (hours) of a growing tissue culture with initial size A(0) = 1 cm2, assuming that the maximum area is M = 16 cm2 and the growth constant is k = 0.1. (a) Find a formula for A(t). Note: The initial condition is satisfied for two values of the constant C. Choose the value of C for which A(t) is increasing. (b) Determine the area of the culture at t = 10 hours. (c) Graph the solution using a graphing utility.arrow_forwardThe long run. A chair manufacturer hires its assembly-line labour for $18 an hour and calculates that the rental cost of its machinery is $6 per hour. Suppose that a chair can be produced using 4 hours of labour or machinery in any combination. The firm is currently using 1 hour of labour for every 3 hours of machine time. (Assume that labour is on the horizontal axis and capital is on the vertical axis). 3. Graphically illustrate your answer by drawing an isoquant, an isocost line for the current combination of labour and capital and an isocost line for the optimal combination of labour and capital. An isocost corresponding to the optimal combination of labour and capital is [a vertical line, a horizontal line, an upward sloping straight line, an upward sloping curve which is not a straight line, a downward sloping straight line, a downward sloping curve which is not a straight line, L-shaped] has slope [ ] at the optimal combination of inputs An isoquant…arrow_forward
 Functions and Change: A Modeling Approach to Coll...AlgebraISBN:9781337111348Author:Bruce Crauder, Benny Evans, Alan NoellPublisher:Cengage Learning
 Linear Algebra: A Modern IntroductionAlgebraISBN:9781285463247Author:David PoolePublisher:Cengage Learning
 Algebra & Trigonometry with Analytic GeometryAlgebraISBN:9781133382119Author:SwokowskiPublisher:Cengage
 Holt Mcdougal Larson Pre-algebra: Student Edition...AlgebraISBN:9780547587776Author:HOLT MCDOUGALPublisher:HOLT MCDOUGAL