
Videos
To graph: Trend line and to interpolate to estimate the number of inventors applying for patents in 2006 and in 2015.
Explanation of Solution
Given information:
Data provided in the question that are used to draw the trend line is
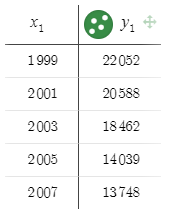
Here in the table
Graph: the
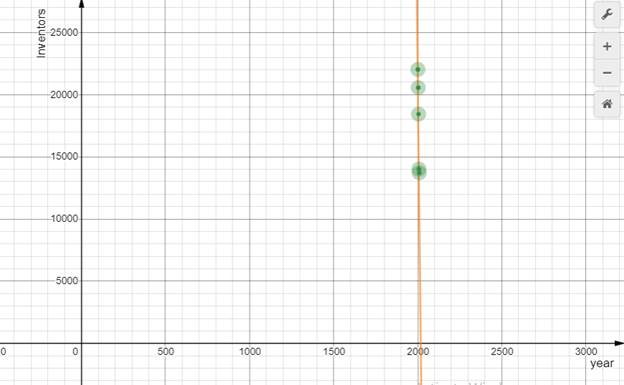
Interpretation:
Interpolate the data to estimate the number of inventors applying for patents in 2006 which can be done by connecting the points on either side of 2006 with a straight line and find the equation of that line.
By observing the graph we can find
Slope
Equation of the trend line
Put
Now to estimate the number of inventors applying for patents in 2006
Substitute
Similarly estimate the number of inventors applying for patents in 2015
Substitute
Chapter 5 Solutions
High School Math 2015 Common Core Algebra 1 Student Edition Grade 8/9
Additional Math Textbook Solutions
Elementary Algebra: Concepts and Applications (10th Edition)
Elementary Algebra
College Algebra in Context with Applications for the Managerial, Life, and Social Sciences (5th Edition)
Elementary and Intermediate Algebra
College Algebra with Modeling & Visualization (6th Edition)


 Algebra and Trigonometry (6th Edition)AlgebraISBN:9780134463216Author:Robert F. BlitzerPublisher:PEARSON
 Contemporary Abstract AlgebraAlgebraISBN:9781305657960Author:Joseph GallianPublisher:Cengage Learning
 Linear Algebra: A Modern IntroductionAlgebraISBN:9781285463247Author:David PoolePublisher:Cengage Learning
 Algebra And Trigonometry (11th Edition)AlgebraISBN:9780135163078Author:Michael SullivanPublisher:PEARSON
 Introduction to Linear Algebra, Fifth EditionAlgebraISBN:9780980232776Author:Gilbert StrangPublisher:Wellesley-Cambridge Press
 College Algebra (Collegiate Math)AlgebraISBN:9780077836344Author:Julie Miller, Donna GerkenPublisher:McGraw-Hill Education