
Concept explainers
Videos
To explain: the characteristics of a graph that represents the rate of change.
Explanation of Solution
Formula used: The slope between the points
In the above formula
The following graph shows the rise and run of the graph.
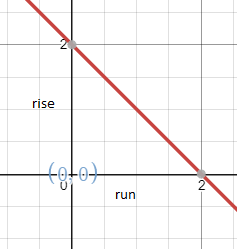
The Rise of the graph shows the number of units the point moves up or down. The Run means the number of points the point moves left or right.
Therefore, the slope of the graph is calculated by the ratio of rise of graph to the run of thegraph. This slope depicts the rate of change.
Chapter 5 Solutions
High School Math 2015 Common Core Algebra 1 Student Edition Grade 8/9
Additional Math Textbook Solutions
Linear Algebra and Its Applications (5th Edition)
Linear Algebra with Applications (2-Download)
College Algebra (6th Edition)
Intermediate Algebra for College Students (7th Edition)
College Algebra with Modeling & Visualization (5th Edition)


 Algebra and Trigonometry (6th Edition)AlgebraISBN:9780134463216Author:Robert F. BlitzerPublisher:PEARSON
 Contemporary Abstract AlgebraAlgebraISBN:9781305657960Author:Joseph GallianPublisher:Cengage Learning
 Linear Algebra: A Modern IntroductionAlgebraISBN:9781285463247Author:David PoolePublisher:Cengage Learning
 Algebra And Trigonometry (11th Edition)AlgebraISBN:9780135163078Author:Michael SullivanPublisher:PEARSON
 Introduction to Linear Algebra, Fifth EditionAlgebraISBN:9780980232776Author:Gilbert StrangPublisher:Wellesley-Cambridge Press
 College Algebra (Collegiate Math)AlgebraISBN:9780077836344Author:Julie Miller, Donna GerkenPublisher:McGraw-Hill Education