Videos
1.
Prepare rate of change analyses for the income statements and balance sheets of Company C for 2016 and 2017 using the year to year approach.
1.
Explanation of Solution
Balance Sheet: Balance Sheet is one of the financial statements which summarize the assets, the liabilities, and the Shareholder’s equity of a company at a given date. It is also known as the statement of financial status of the business.
Income statement: The financial statement which reports revenues and expenses from business operations and the result of those operations as net income or net loss for a particular time period is referred to as income statement.
Prepare rate of change analyses for the income statements of Company C for 2016 and 2017 using the year to year approach:
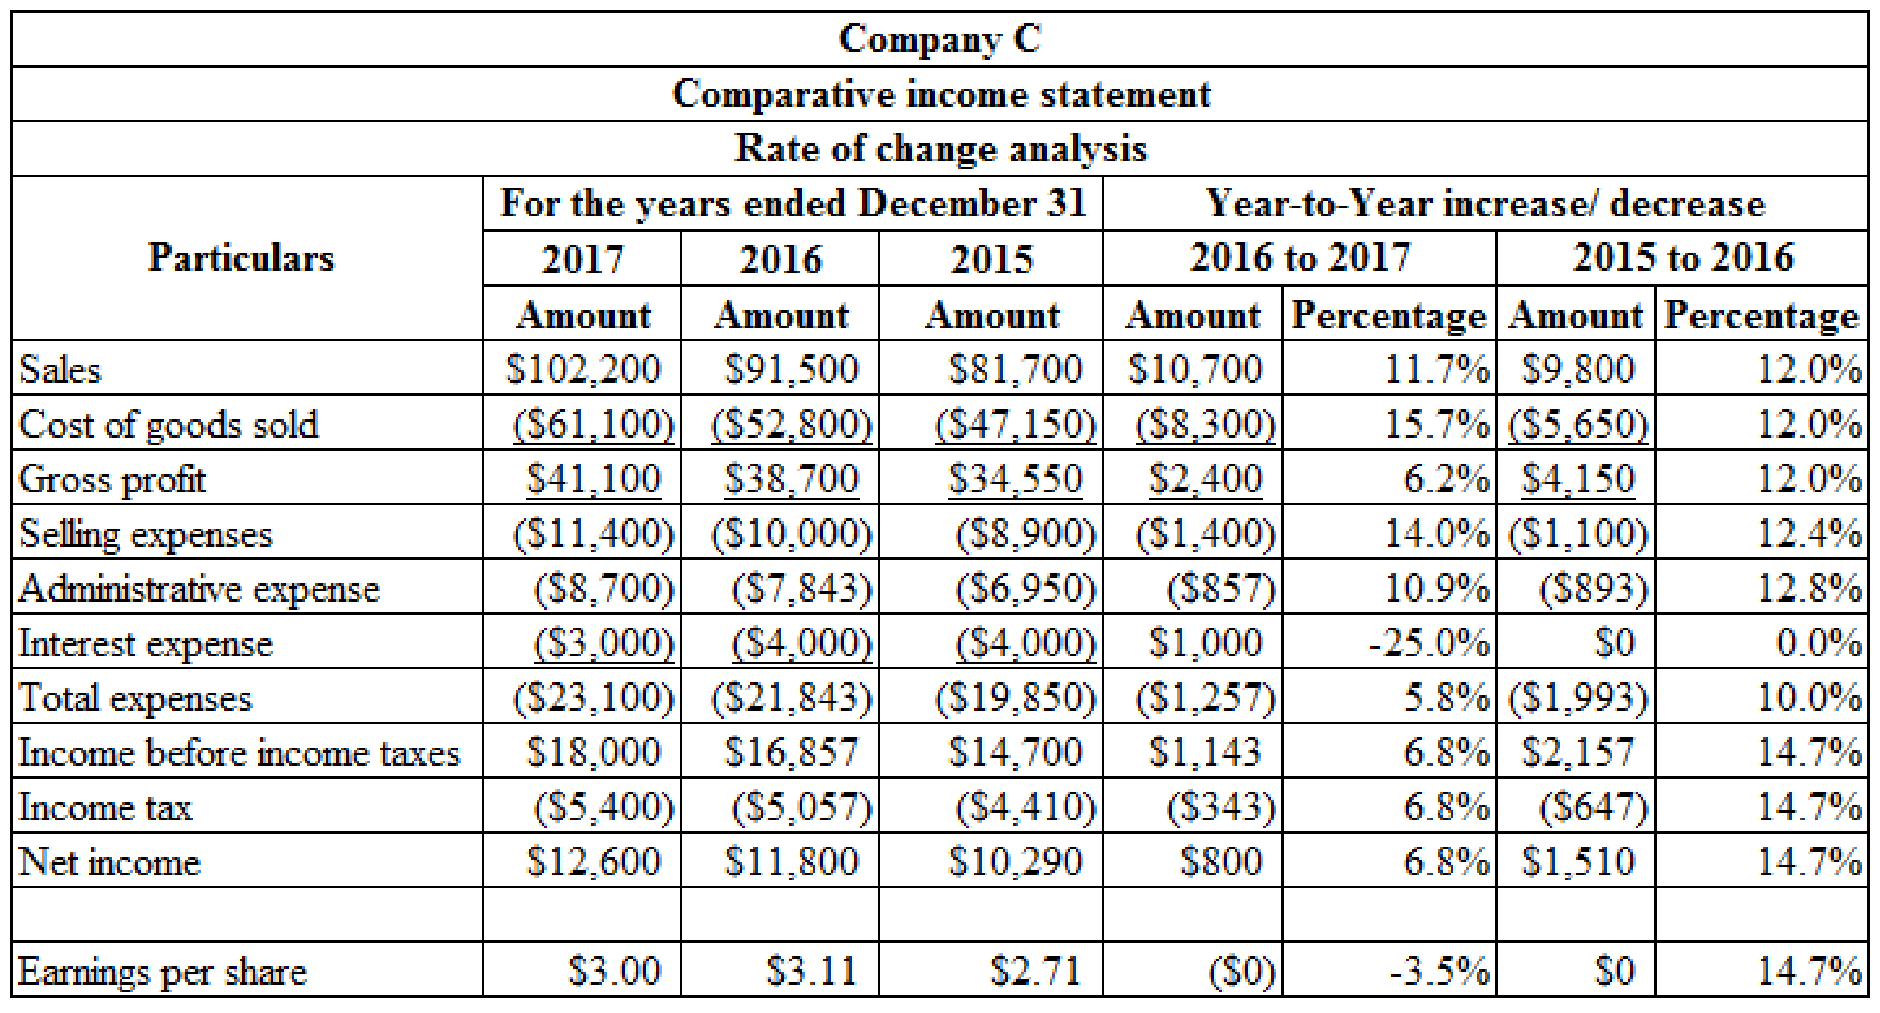
Table (1)
Prepare rate of change analyses for the
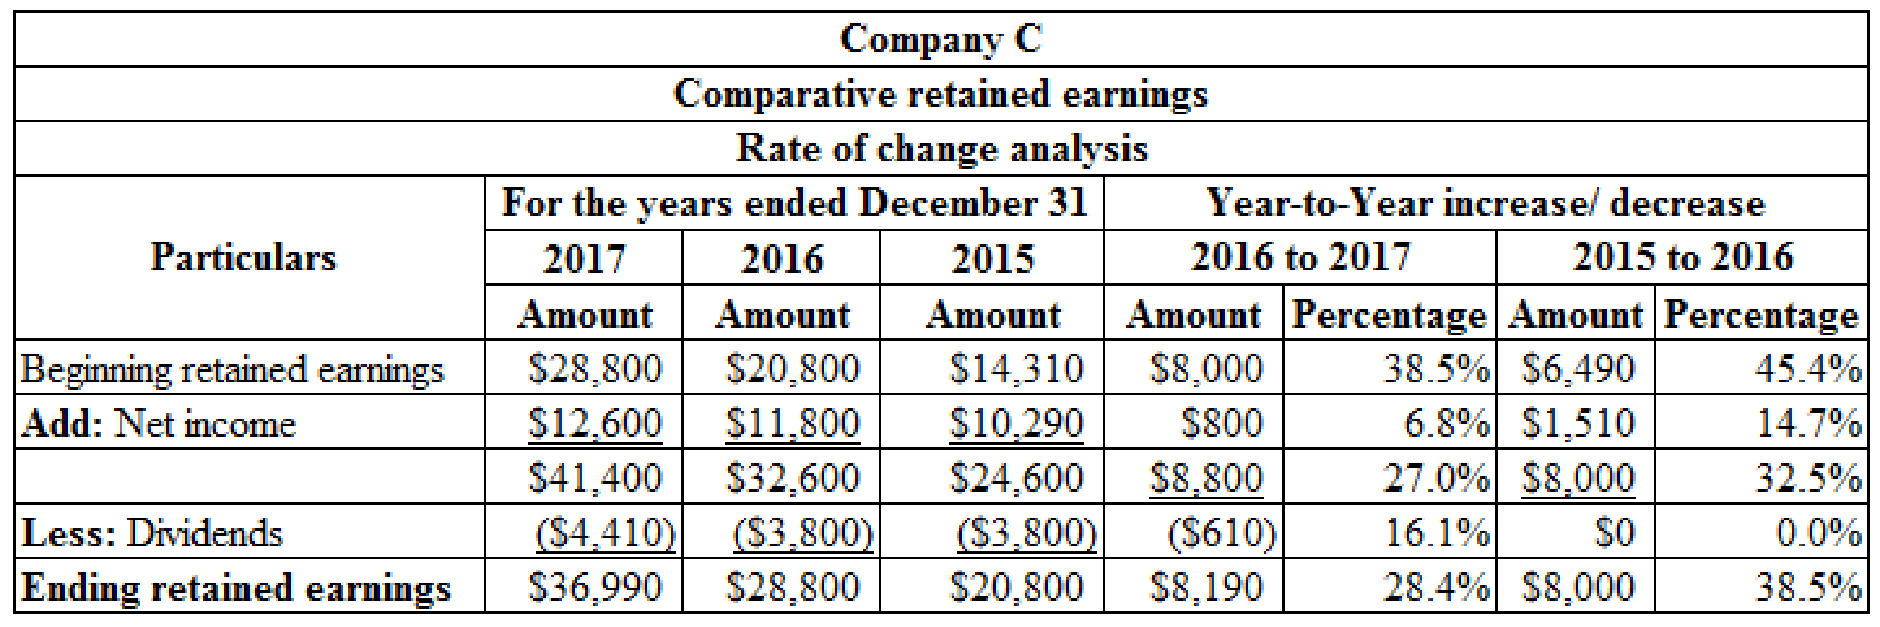
Table (2)
Prepare rate of change analyses for the balance sheets of Company C for 2016 and 2017 using the year to year approach:
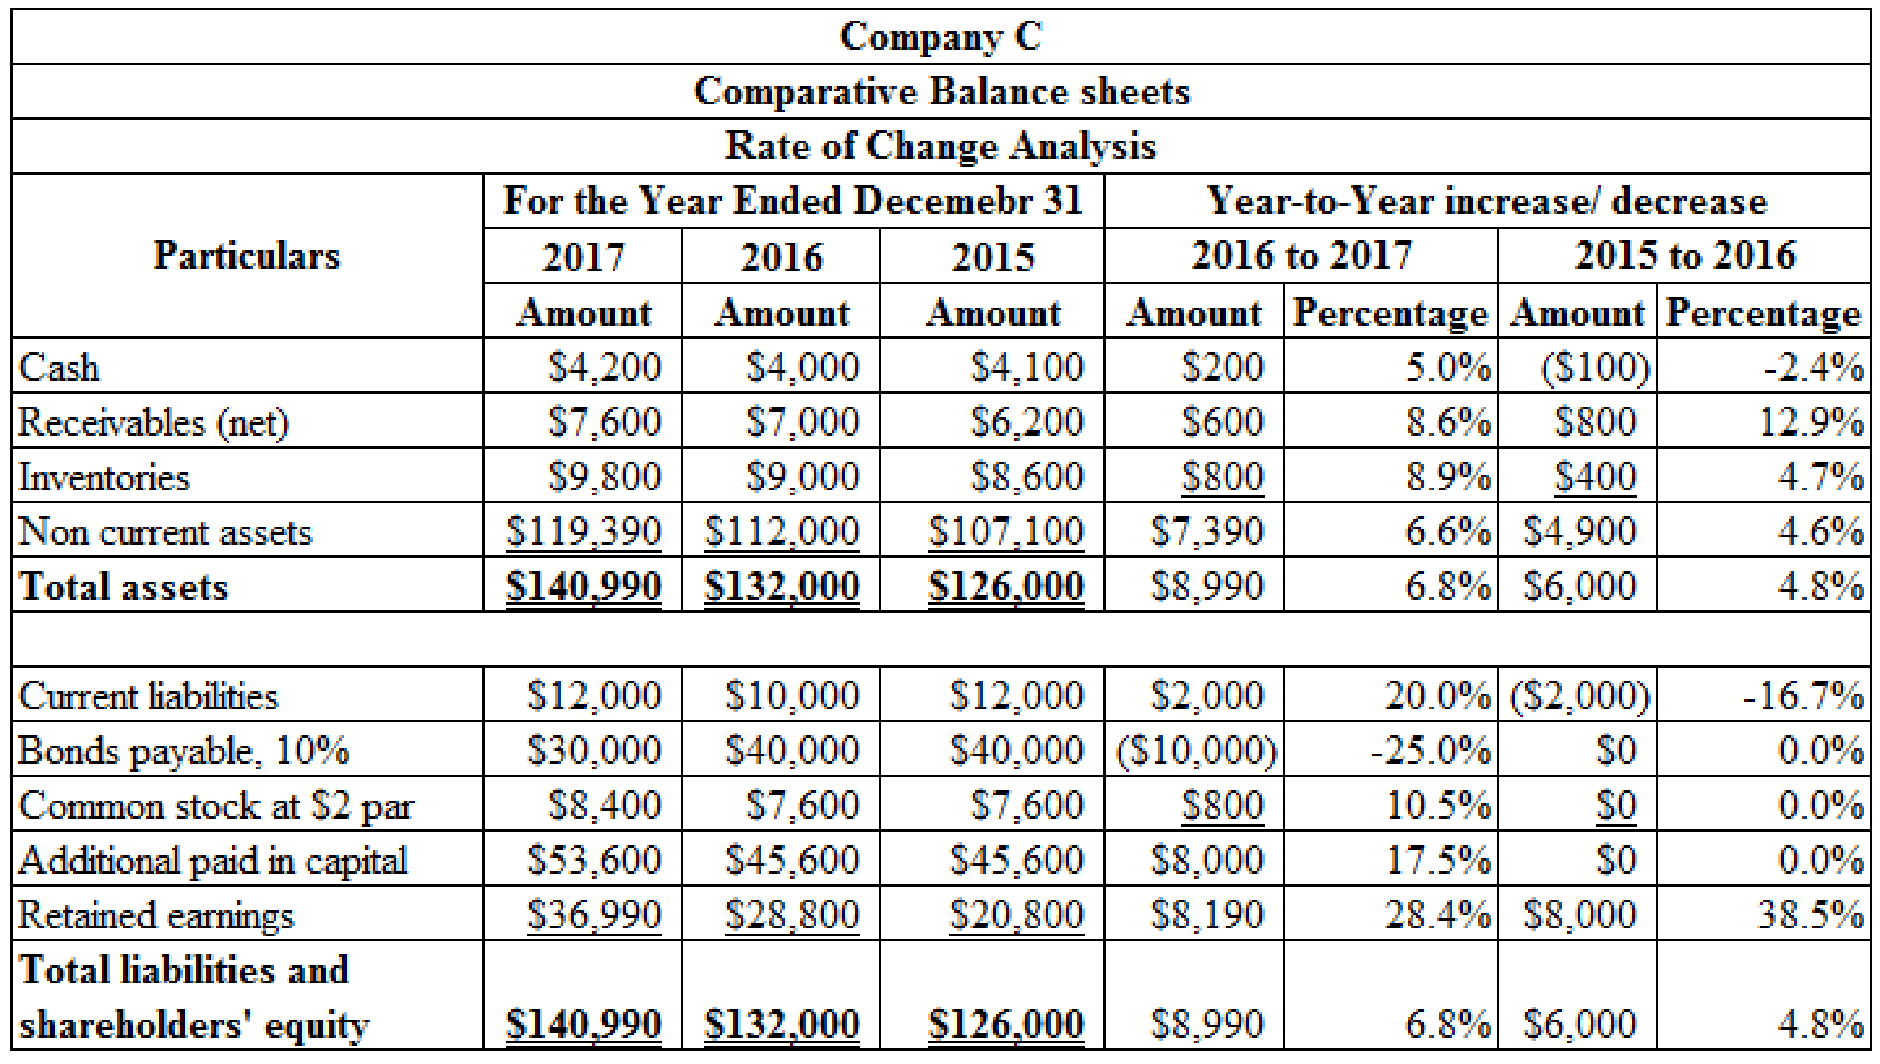
Table (3)
2. (a)
Compute
2. (a)
Explanation of Solution
Current ratio: Current ratio is one of the
Compute current ratio for 2016 and 2017:
| Ratios and Formula | 2017 | 2016 |
|
Current ratio: |
Table (4)
2. (b)
Compute inventory turnover for 2016 and 2017.
2. (b)
Explanation of Solution
Inventory Turnover Ratio: This ratio is a financial metric used by a company to quantify the number of times inventory is used or sold during the accounting period. It is calculated by using the formula:
Compute inventory turnover for 2016 and 2017:
| Ratios and Formula | 2017 | 2016 |
|
Inventory turnover: Average inventory: |
|
|
Table (5)
2. (c)
Compute receivable turnover for 2016 and 2017.
2. (c)
Explanation of Solution
Receivables turnover ratio: Receivables turnover ratio is mainly used to evaluate the collection process efficiency. It helps the company to know the number of times the
Compute receivable turnover for 2016 and 2017:
| Ratios and Formula | 2017 | 2016 |
|
Receivables turnover: Average accounts receivable: |
|
|
Table (6)
2. (d)
Compute net profit margin for 2016 and 2017.
2. (d)
Explanation of Solution
Net profit margin: It is one of the profitability ratios. Profit margin ratio is used to measure the percentage of net income that is being generated per dollar of revenue or sales.
Compute net profit margin for 2016 and 2017:
| Ratios and Formula | 2017 | 2016 |
|
Net profit margin: |
Table (7)
2. (e)
Compute earnings per share for 2016 and 2017.
2. (e)
Explanation of Solution
Earnings per Share: Earnings per share help to measure the profitability of a company. Earnings per share are the amount of profit that is allocated to each share of outstanding stock.
Compute earnings per share for 2016 and 2017:
| Ratios and Formula | 2017 | 2016 |
|
Earnings per share: |
Table (8)
2. (f)
Compute return on total assets ratio for 2016 and 2017.
2. (f)
Explanation of Solution
Return on total assets: Return on investments (assets) is the financial ratio which determines the amount of net income earned by the business with the use of total assets owned by it. It indicates the magnitude of the company’s earnings with relative to its total assets. Return on investment is calculated as follows:
Compute return on total assets for 2016 and 2017:
| Ratios and Formula | 2017 | 2016 |
|
Return on total assets: Average total assets: |
|
|
Table (9)
Working note: 1 Determine the after tax rate:
| Ratios and Formula | 2017 | 2016 |
|
After tax rate: |
Table (10)
2. (g)
Compute return on common
2. (g)
Explanation of Solution
Return on common stockholders’ equity ratio: It is a profitability ratio that measures the profit generating ability of the company from the invested money of the shareholders. The formula to calculate the return on equity is as follows:
Compute return on common stockholders’ equity for 2016 and 2017:
| Ratios and Formula | 2017 | 2016 |
|
Return on common stockholders’ equity: Average stockholders’ equity: |
|
|
Table (11)
2. (h)
Compute debt to assets for 2016 and 2017.
2. (h)
Explanation of Solution
Debt to assets ratio: The debt to asset ratio shows the relationship between total asset and the total liability of the company. Debt ratio reflects the financial strategy of the company. It is used to measure the percentage of company’s assets that are financed by long term debts. Debt to assets ratio is calculated by using the formula:
Compute debt to assets for 2016 and 2017:
| Ratios and Formula | 2017 | 2016 |
|
Debt to assets ratio: |
Table (12)
3.
Explain the possible reasons for the decrease in the market price per share in 2017.
3.
Explanation of Solution
The probable reason for the decrease in the market price per share in 2017:
- The current ratio, receivable turnover ratio, net profit margin ratio, return on total assets, return on shareholders’ equity and earnings per share ratio in year 2017 are less than the result provided in the year of 2016.
- The financial condition of the company is not as strong as it was in 2016 because earnings per share of Company C have decreased from $3.11(2016) to $3 (2017) and the debt to assets ratio has also decreased from 37.9% (2016) to $29.8% (2017).
Want to see more full solutions like this?
Chapter 5 Solutions
Intermediate Accounting: Reporting and Analysis


- Using the Value Line Investment Survey report in Exhibit 11.5, find the following information for Apple. What was the amount of revenues (i.e., sales) generated by the company in 2017? What were the latest annual dividends per share and dividend yield? What is the earnings per share (EPS) projection for 2019? How many shares of common stock were outstanding? What were the book value per share and EPS in 2017? How much long-term debt did the company have in the third quarter of 2018?arrow_forwardFrom the French Instrument Corporation second-quarter report ended 2018, do a vertical analysis for the second quarter of 2018. (Input all answers as positive values except other (income) which should be indicated by a minus sign. Round your answers to the nearest hundredth percent.) FRENCH INSTRUMENT CORPORATION AND SUBSIDIARIES Consolidated Statements of Operation (Unaudited) (In thousands of dollars, except share data) Second Quarter 2018 2017 Percent of net Net sales $6,644 $6,888 Cost of sales 4,080 4,453 Gross margin 2,564 2,435 Expenses: Selling, general and administrative 1,836 1,774 Product development 166 156 Interest expense 89 114 Other (income), net (181) (108) Total expenses 1,910 1,936 Income before income taxes 654 499 Provision for income taxes 256 200 Net income $398 $299 Net income per common share* $0.05 $0.03 Weighted average number of common shares and equivalents 6,673,673…arrow_forwardPlease find below Financial Statement extracts of Nestle from year 2017 and 2018. Based on this information please answer following question from a perspective of Financial Analyst (justify your answers with data as well the reason for choosing your ratios for your analysis) .The company’s total assets at year-end 2016 were CHF 131,900 million. What reasonable conclusions an analyst might make about the companies efficiency, Companies solvency, Liquidity and Profitability? In millions of CHF Notes 2018 2017 * Sales 3 91,439 89,590 Cost of goods sold (46,070) (45,571) Trading operating profit 3 13,789 13,277 Operating profit 13,752 10,156 Profit before taxes, associates and joint ventures 12,991 9,460 Taxes 13 (3,439) (2,773) Profit for the year 10,468 7,511 Notes 2018 2017 * Assets Current assets Cash and cash equivalents 12/16…arrow_forward
- Computing trend analysis and return on common equity Net sales revenue, net income, and common stockholders’ equity for Azbel Mission Corporation, a manufacturer of contact lenses, follow for a four-year period. Requirements Compute trend analyses for each item for 2017-2019. Use 2016 as the base year, and round to the nearest whole percent. Compute the rate of return on common stockholders’ equity for 2017-2019, rounding to three decimal places.arrow_forwardRequirement: Use the 2015 data for Prince Company. Assume a stock price of $28 per share. Compute the ratios. Prince Company paid $7,000 out in dividends for the year. Show how you can figure out that the company paid $7,000 out in dividends for the year. 2015 2014 Income Statement Sales revenue 190,000 167,000 Cost of goods sold 112,000 100,000 Gross profit 78,000 67,000 Operating expenses and interest expenses 56,000 53,000 Pretax income 22,000 14,000 Income tax 8,000 4,000 Net income 14,000 10,000 Balance Sheet Cash 4,000 7,000 Accounts receivable (net) 14,000 18,000 Inventory 40,000 34,000 Operational assets (net) 45,000 38,000 Total assets 103,000 97,000 Current liabilities (no interest) 16,000 17,000 Long-term liabilities (10% interest) 45,000 45,000 Common stock (par $5) 30,000…arrow_forwardCalculating trend analysis Muscateer Corp reported the following revenues and net income amounts: Requirements Calculate Muscateer’s trend analysis for revenues and net income Use 2016 as the base year and round to the nearest percent. Which measure increased at a higher rate during 2017-2019?arrow_forward
 Intermediate Accounting: Reporting And AnalysisAccountingISBN:9781337788281Author:James M. Wahlen, Jefferson P. Jones, Donald PagachPublisher:Cengage Learning
 Financial Accounting: The Impact on Decision Make...AccountingISBN:9781305654174Author:Gary A. Porter, Curtis L. NortonPublisher:Cengage Learning
 Pfin (with Mindtap, 1 Term Printed Access Card) (...FinanceISBN:9780357033609Author:Randall Billingsley, Lawrence J. Gitman, Michael D. JoehnkPublisher:Cengage Learning
 Financial AccountingAccountingISBN:9781305088436Author:Carl Warren, Jim Reeve, Jonathan DuchacPublisher:Cengage Learning
 PFIN (with PFIN Online, 1 term (6 months) Printed...FinanceISBN:9781337117005Author:Randall Billingsley, Lawrence J. Gitman, Michael D. JoehnkPublisher:Cengage Learning