
1.
The Pearson product-moment
1.
Answer to Problem 1TP
The
Explanation of Solution
The given information represents the data set as follows:
| Number correct (out of a possible 20) | Attitude (out of a possible 100) |
| 17 | 94 |
| 13 | 73 |
| 12 | 59 |
| 15 | 80 |
| 16 | 93 |
| 14 | 85 |
| 16 | 66 |
| 16 | 79 |
| 18 | 77 |
| 19 | 91 |
Calculation:
The formula for calculating Pearson product moment is given by;
- n is the
size of the sample . - X is the number correct (out of a possible 20) on the X variable.
- Y is the Attitude (out of a possible 100) on the Y variable.
| Number correct (X) | Attitude (Y) | |||
| 17 | 94 | 289 | 8836 | 1598 |
| 13 | 73 | 169 | 5329 | 949 |
| 12 | 59 | 144 | 3481 | 708 |
| 15 | 80 | 225 | 6400 | 1200 |
| 16 | 93 | 256 | 8649 | 1488 |
| 14 | 85 | 196 | 7225 | 1190 |
| 16 | 66 | 256 | 4356 | 1056 |
| 16 | 79 | 256 | 6241 | 1264 |
| 18 | 77 | 324 | 5929 | 1386 |
| 19 | 91 | 361 | 8281 | 1729 |
| 156 | 797 | 2476 | 64727 | 12568 |
Substitute 156 for
The correlation between number correct and attitude is positive because the value of correlation coefficient is (0.59) lies in between 0 to 1.
2.
The
2.
Answer to Problem 1TP
There is a direct relationship between number of correct and attitude because, if the value of correct increases then the value of attitude will also increase.
Explanation of Solution
Calculation:
Take number correct on the X-axis and attitude on the Y-axis to sketch the scatter plot.
The scattered plot is obtained as:
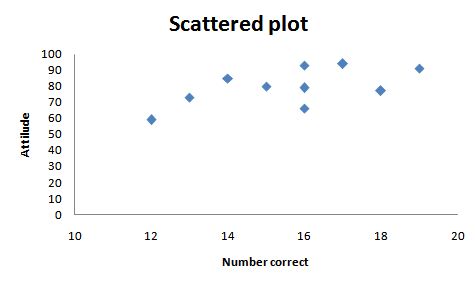
Fig (1)
The above scatter plot represents the direct relationship between number of correct and attitude because, if the value of number correct increases then the value of attitude will also increase.
Want to see more full solutions like this?
Chapter 5 Solutions
Statistics for People Who (Think They) Hate Statistics

 MATLAB: An Introduction with ApplicationsStatisticsISBN:9781119256830Author:Amos GilatPublisher:John Wiley & Sons Inc
 Probability and Statistics for Engineering and th...StatisticsISBN:9781305251809Author:Jay L. DevorePublisher:Cengage Learning
 Statistics for The Behavioral Sciences (MindTap C...StatisticsISBN:9781305504912Author:Frederick J Gravetter, Larry B. WallnauPublisher:Cengage Learning
 Elementary Statistics: Picturing the World (7th E...StatisticsISBN:9780134683416Author:Ron Larson, Betsy FarberPublisher:PEARSON
 The Basic Practice of StatisticsStatisticsISBN:9781319042578Author:David S. Moore, William I. Notz, Michael A. FlignerPublisher:W. H. Freeman
 Introduction to the Practice of StatisticsStatisticsISBN:9781319013387Author:David S. Moore, George P. McCabe, Bruce A. CraigPublisher:W. H. Freeman