![MindTap Engineering for Das/Sobhan's Principles of Geotechnical Engineering, 9th Edition, [Instant Access], 2 terms (12 months)](https://s3.amazonaws.com/compass-isbn-assets/textbook_empty_images/large_textbook_empty.svg)
MindTap Engineering for Das/Sobhan's Principles of Geotechnical Engineering, 9th Edition, [Instant Access], 2 terms (12 months)
9th Edition
ISBN: 9781305971257
Author: Braja M. Das; Khaled Sobhan
Publisher: Cengage Learning US
expand_more
expand_more
format_list_bulleted
Concept explainers
Videos
Textbook Question
Chapter 5, Problem 5.1CTP
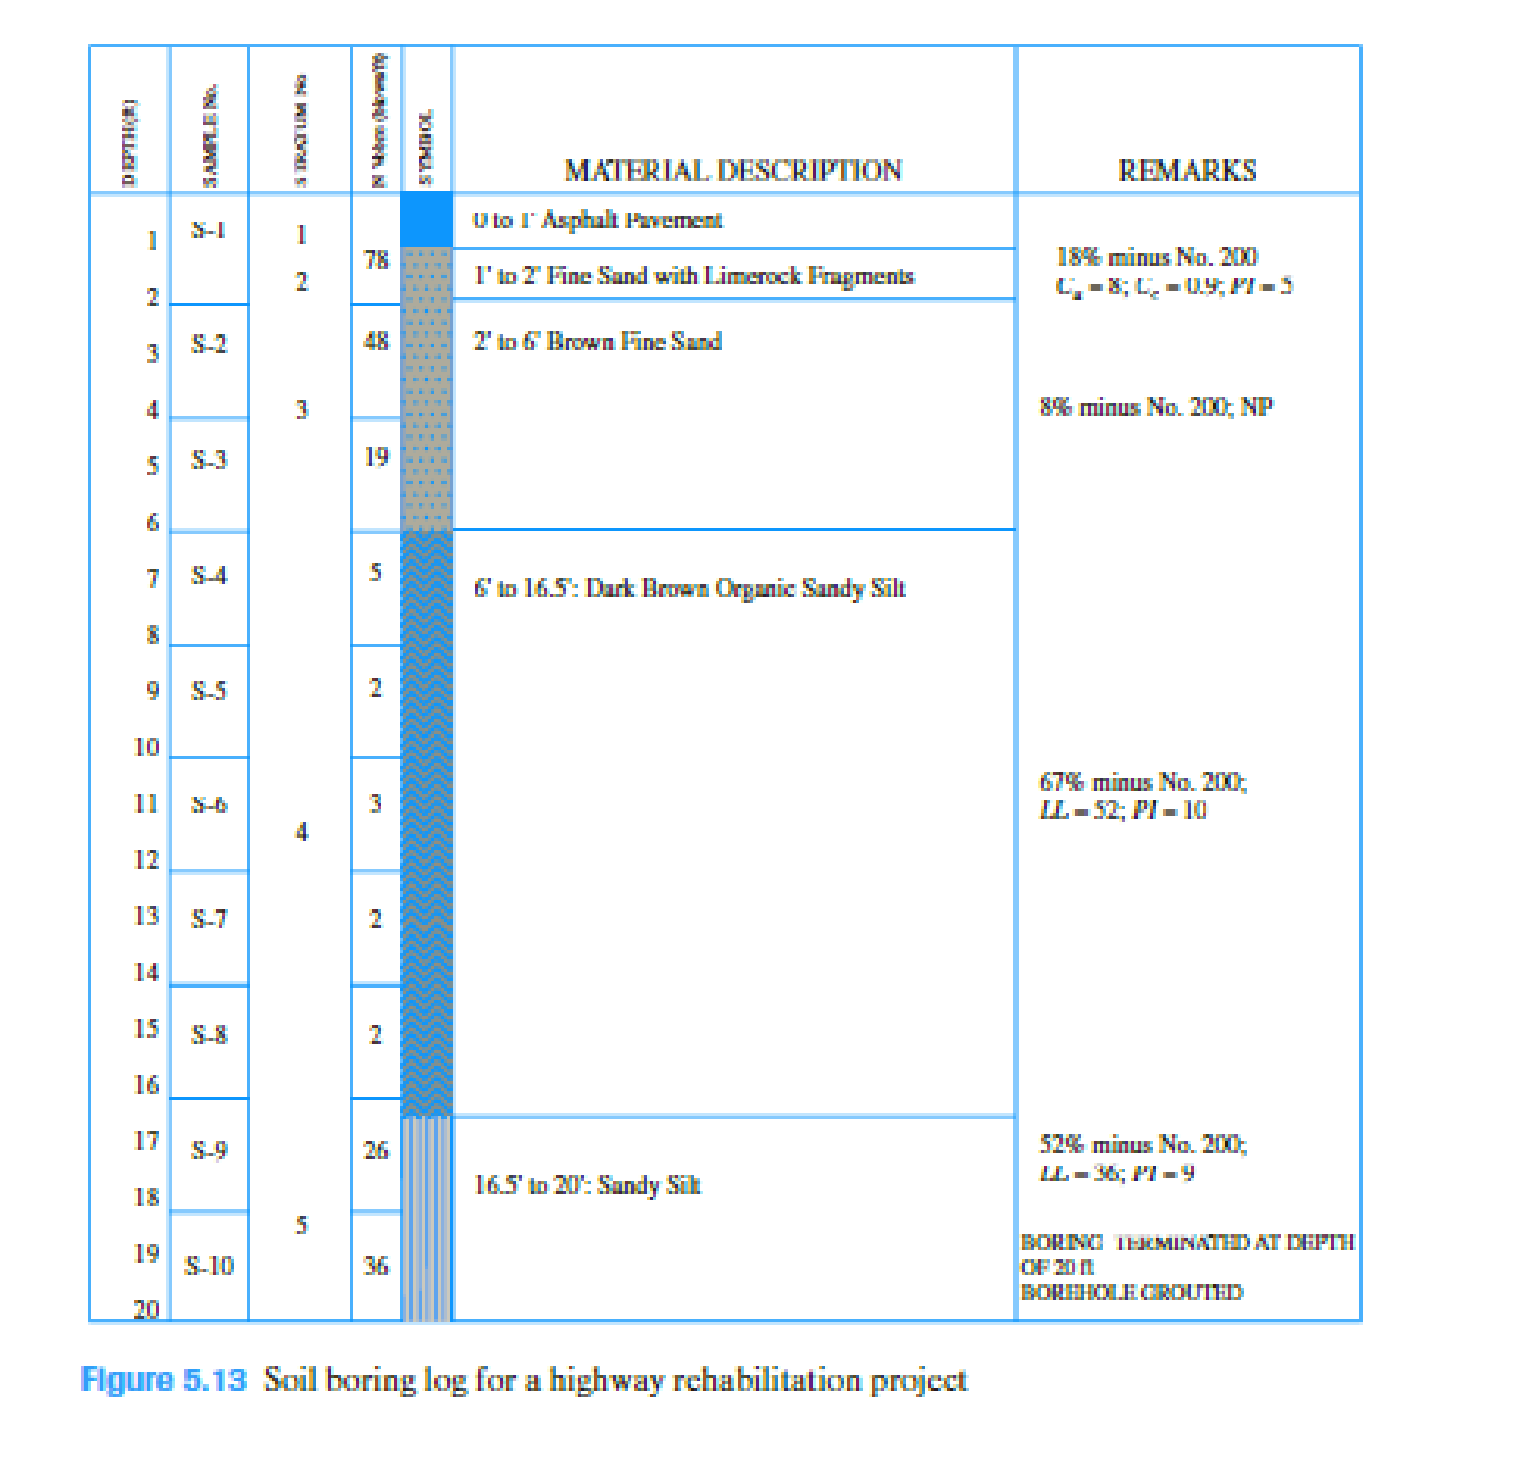
The subsurface characteristics for a highway pavement rehabilitation project in the southeastern United States are shown in a “boring log” in Figure 5.13. The highway structure consists of the asphalt pavement underlain by four different soil strata up to a depth of 20 ft, after which the boring was terminated. Some data on the grain size and plasticity characteristics are also provided for each stratum. Perform the following tasks:
- 1. Determine the AASHTO soil classification and the group index (GI) for each layer.
- 2. Determine the “most probable” group symbols and group names for the various layers according to the Unified soil classification system. Use Table 5.3 and the soil characteristics given in the boring log.
Expert Solution & Answer

Trending nowThis is a popular solution!

Students have asked these similar questions
Calculate layer thickness for section AA
GIVEN: SN1= 3.2
SN2= 3.8
SN3 = 4.5
In the conventional laboratory compression test, what is the cause of soil volume decrease?
I am working on a lab report for a sieve analysis that was conducted in the lab. I got that the soil was made up of approximately: 20.5% gravel, 77.8% sand, and 1.7% fines. The values for the coefficient of uniformity (Cu) and coefficient of gradation (Cc) are 10.56 and 0.528 respectively. What does this mean when it comes to engineering design? Would the soil be considered good for building a structure? If so, is there a specific type of structure that would work best with this type of soil?
Chapter 5 Solutions
MindTap Engineering for Das/Sobhan's Principles of Geotechnical Engineering, 9th Edition, [Instant Access], 2 terms (12 months)
Knowledge Booster


Learn more about
Need a deep-dive on the concept behind this application? Look no further. Learn more about this topic, civil-engineering and related others by exploring similar questions and additional content below.Similar questions
- The soil sample is 75% gravel with laboratory result shown below. Is it well graded or poorly graded? D10 = 0.08 mm D30 = 0.22 mm D60 = 0.41 mm Select one: a. Poorly graded b. Well gradedarrow_forward4. Phase Diagram A soil sample was obtained at the underground parking garage that Dr. Barry is constructing at his home with a volume (VT) of 0.05 ft', total weight (WT) of 4.2 lbs, weight of water (Ww) of 0.37 lbs and a specific gravity (Gs) 2.70. Draw a complete phase diagram and determine the void ratio (e), moist unit weight (y), saturated unit weight (ysat), dry unit weight (Yary), weight of the solids (W.), volume occupied by the solids (V.), volume occupied by the water (V), volume occupied by the air (VA). volume of the voids (Vv), porosity (n), moisture content (w), and percent saturation (S). Use English units in your solution. Show all of your work.arrow_forward00 docs.google.com/forms/ A It is easier than the sieve analysis CH soil is formed by chemical 1/1 weathering * True False Neither true nor false The grain size distribution has 0/2 been conducted on a soil sample and the following have been obtained: Percentage of passing from sieve number 200 is 47%, LL = 30%, PL = 15% Using the above information, the soil classification according to the USCS is * :O A5arrow_forward
- Q3. A 1200 g sample of Gravel in the SSD condition in air and weighed 770 g when immersed in water. Also, a 500 g sample of Sand in the SSD condition in air and weighed 300 g when immersed in water Calculate the BSG(SSD) of the sand and gravel 1) the BSG (SSD) of the Gravel * 1.2.791 2.4.71 3.3.703 4.2.50 2) the BSG (SSD) of the Sand * 1.2.221 2.3.590 3.2.500 4.3.232 Choose one answer and write the answer number for mearrow_forwardSoil classification requires all of the results of the following tests: Liquid limit and Plastic limit tests Atterberg limit and Hydrometer tests Atterberg limit and grain size analysis test Sieve and Hydrometer analysis testsarrow_forwardA liquid limit test on a clay was performed with the following results. The natural water content of the clay is 38% and plastic limit is 21%. Number of Blows 6 12 20 28 32 Water content (%) 52.5 47.1 42.3 38.6 37.5 What is the liquid limit of this clay? (Use Interpolation) Group of answer choices 39.85% 39.99% 36.74% 38.63% Please answer this asap for upvote. Thanksarrow_forward
- A cohesive soil sample is subjected to an unconfined compression test. The sample fails at a pressure of 3850 lb/ft2 [i.e., unconfined compressive strength lb/ft2]. Determine the soil’s cohesion.arrow_forward2.7 The results of a liquid limit test and a plastic limit test on a sample of soil are given below: liquid limit cone penetration (mm) water content (%) 21.2 56.0 23.2 24.7 14.8 50.8 16.9 19.1 52.9 54.2 57.3 58.7 plastic limit water content of threads (%%) 26.6 and 27.3 Determine the liquid limit, plastic limit, plasticity index and soil classification,arrow_forwardPlz, solve this problem as detail. Geotechnical Engineering-1arrow_forward
- A materials supplier presented the following values for a sample of their CBR tests for subgrade soil. What mean absolute deviation (MD) for the results. 4.1 4.3 4.5 4.7 4.9 4 3 2 CBR Frequency 1 2 4.55 O 2.33 0.19 O 0.21arrow_forwardSoil resistance to failure is provided by its shear strength. How is shear strength developed in different types of soil?arrow_forwardThree groups of students from the Geotechnical Engineering class collected soil-aggregate samples for laboratory testing from a recycled aggregate processing plant in Palm Beach County, Florida. Three samples, denoted by Soil A, Soil B, and Soil C, were collected from three locations of the aggregate stockpile, and sieve analyses were conducted (see Figure 2.35). (a) (b) Figure 2.35 (a) Soil-aggregate stockpile; (b) sieve analysis (Courtesy of Khaled Sobhan, Florida Atlantic University, Boca Raton, Florida) a. Determine the coefficient of uniformity and the coefficient of gradation for Soils A, B, and C. b. Which one is coarser: Soil A or Soil C? Justify your answer. c. Although the soils are obtained from the same stockpile, why are the curves so different? (Hint: Comment on particle segregation and representative field sampling.) d. Determine the percentages of gravel, sand and fines according to Unified Soil Classification System.arrow_forward
arrow_back_ios
SEE MORE QUESTIONS
arrow_forward_ios
Recommended textbooks for you
 Principles of Geotechnical Engineering (MindTap C...Civil EngineeringISBN:9781305970939Author:Braja M. Das, Khaled SobhanPublisher:Cengage Learning
 Construction Materials, Methods and Techniques (M...Civil EngineeringISBN:9781305086272Author:William P. Spence, Eva KultermannPublisher:Cengage Learning
Principles of Geotechnical Engineering (MindTap C...
Civil Engineering
ISBN:9781305970939
Author:Braja M. Das, Khaled Sobhan
Publisher:Cengage Learning
Construction Materials, Methods and Techniques (M...
Civil Engineering
ISBN:9781305086272
Author:William P. Spence, Eva Kultermann
Publisher:Cengage Learning
How Are Highways Designed?; Author: Practical Engineering;https://www.youtube.com/watch?v=9XIjqdk69O4;License: Standard Youtube License