
Concept explainers
Videos
A sieve analysis test was performed on a sample of aggregate and produced the results shown in Table P5.21.
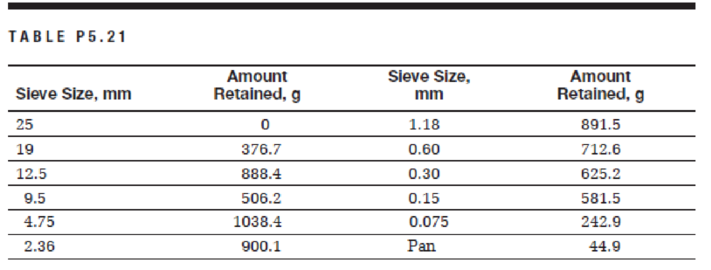
Calculate the percent passing through each sieve. Plot the percent passing versus sieve size on:
a. a semilog gradation chart, and
b. a 0.45 gradation chart (Figure A.25).
What is the maximum size? What is the nominal maximum size?
Want to see the full answer?
Check out a sample textbook solution
Chapter 5 Solutions
Pearson eText for Materials for Civil and Construction Engineers -- Instant Access (Pearson+)
Additional Engineering Textbook Solutions
Structural Analysis (10th Edition)
Elementary Surveying: An Introduction To Geomatics (15th Edition)
Foundation Design: Principles and Practices (3rd Edition)
Elementary Surveying (14th Edition)
Structural Steel Design (6th Edition)
Starting Out with Java: From Control Structures through Objects (7th Edition) (What's New in Computer Science)


- Calculate the sieve analysis shown in Table P5.19 and plot on a semilog gradation paper. What is the maximum size? What is the nominal maximum size?arrow_forwardSieve analysis test for fine aggregates was performed on a sample of fine aggregates and produced the following results: a. Calculate the percent passing through each sieve. b. Plot the percent finer in a semi-log gradation chart. c. What is the maximum aggregate size of the sample? d. What is the nominal maximum aggregate size of the sample? e. What is the fineness modulus? Is it in typical range? " Sieve Size, 9.5 4.75 3.35 2.36 2.00 1.18 0.85 0.60 0.425 0.30 0.25 0.18 0.15 (No. 0.075 Pan mm (in) (3/8) (No. 4) (No. 6) (No. 8) (No. 10) (No. 16) (No. 20) (No. 30) (No. 40) (No. 50) (No. 60) (No. 80) 100) (No. 200)| Amount 25 59 75 86 115 136 169 192 225 198 173 112 90 33 12 Datained.arrow_forwardReferring to the aggregate gradations A, B, and C in Figure P5.26, answer the following questions: a. What is the maximum size of each gradation? b. What is the nominal maximum size of each gradation? c. Classify each gradation as dense, open, or gap indicating the reason for each classification. 100 A 80- 60 40 0.075 0.30 1.18 2.36 4.75 9.5 12.5 19.0 25.0 0.15 0.60 Sieve sizes (mm) FIGURE P5.26 Percent passing 20arrow_forward
- Sieve analysis test for fine aggregates was performed on a sample of fine aggregates and produced the following results: a. Calculate the percent passing through each sieve. b. Plot the percent finer in a semi-log gradation chart. c. What is the maximum aggregate size of the sample? d. What is the nominal maximum aggregate size of the sample? e. What is the fineness modulus? Is it in typical range? Sieve Size, 9.5 4.75 3.35 2.36 2.00 1.18 0.85 0.60 0.425 0.30 0.25 0.18 0.15 (No. 0.075 Pan mm (in) (3/8) (No. 4)(No. 6) (No. 8) (No. 10) (No. 16) (No. 20)|(No. 30) (No. 40)|(No. 50)|(No. 60) (No. 80) 100) |(No. 200) Amount 25 59 75 86 115 136 169 192 225 198 173 112 90 33 12 Retained, garrow_forwardCalculate the fineness modulus of this fine aggregate sample. Report your answer to the nearest 1 decimal place (tens). Sieve Size, Retained Mass, % Retained Cumulative % % Passing mm (US) 12.5 (1/2") 9.5 (3/8") 4.75 (#4) 2.36 (#8) 1.18 (#16) 0.600 (#30) 0.300 (#50) 0.150 (#100) 0.075 (#200) Grams on Sieves retained on seives 3.0 0.36 0.36 99.64 10.0 1.22 1.58 98.42 30.0 3.65 5.22 94.78 55.0 6.68 11.91 88.09 230.0 27.95 39.85 60.15 175.0 21.26 61.12 38.88 140.0 17.01 78.13 21.87 120.0 14.58 92.71 7.29 40.0 4.86 97.57 2.43 Pan 20.0 2.43 100.00 0.00 Total: 823.0arrow_forwardA sieve analysis test was performed on a sample of fine aggregate and produced the results in Table below. Calculate the percent passing through each sieve. What is the maximum size? What is the nominal maximum size? What is the Fineness Modulus? Plot the percent passing versus sieve size on a semi-log gradation size. (You can use Excel sheets or you can draw on a semi-log attached to page 3 of this assignment) Sieve size (mm) Amount retained (g) Cumulative amount retained (g) Cumulative percentage retained Percent passing 12.5 0 9.5 21 4.75 104 2.36 79 1.18 78 0.6 51 0.30 78 0.15 82 0.075 39 pan 5arrow_forward
- Sieve analysis test for fine aggregates was performed on a sample of fine aggregates and produced the following results: a. Calculate the percent passing through each sieve. b. Plot the percent finer in a semi-log gradation chart. c. What is the maximum aggregate size of the sample? d. What is the nominal maximum aggregate size of the sample? e. What is the fineness modulus? Is it in typical range? 0.18 0.15 (No. (3/8) INo. 41 (INo. 6) (No. 8)|(No. 10) (No. 16) (No. 20)|INo. 30)|(No. 40)|(No. So) (No. 60)|(No. 80) 100) Sieve Size, 9.5 4.75 3.35 2.36 2.00 1.18 0.85 0.60 0.425 0.30 0.25 0.075 Pan mm (in) (No. 200) Amount 25 59 75 86 115 136 169 192 225 198 173 112 90 33 12 Retained,arrow_forwardA sieve analysis test was performed on a sample of coarse aggregate and produced the following results:a.) Calculate the percent passing through each sieve.b.) What is the maximum size?c.) What is the nominal maximum size?arrow_forwardThe table below presents the results of the sieve analysis conducted on a sample of aggregate. Given the bulk specific gravities of 2.65 for coarse aggregate, 2.69 for fine aggregate, and 2.73 for filler, determine the bulk density of the aggregate sample. Additionally, calculate the maximum aggregate size and nominal aggregate maximum size. Sieve size (mm) 37.5 % Passing 100 Specification limit 25 92 100 90-100 19 83 76-90 12.5 9.5 4.75 2.36 0.3 71 62 53 32 15 56-80 48-74 29-59 19-45 5-17 0.075 4 2-8arrow_forward
- 5.17 Calculate the sieve analysis of the following aggregate and plot on a semilog gradation paper. What is the maximum size? What is the nominal maximum size? Sieve Size 25 mm (1 in.) 9.5 mm (3/8 in.) 4.75 mm (No. 4) 2.00 mm (No. 10) 0.425 mm (No. 40) 0.075 mm (No.200) Pan Amount Cumulative Amount Cumulative Percent Retained, g Retained, g 0 47.1 239.4 176.5 92.7 73.5 9.6 Retained Percent Passingarrow_forwardQ3) The result of sieve analysis of a sample of aggregate given in the Table below. According to ASTM C 33, the sample is acceptable or not? BS Total mass of sample 4 80 g Sieve size 10 mm 5 mm 2.36 mm 1.18 mm 600 μm 300 μm 150 μm €150μm ASTM in 4 8 16 30 50 100 <-100 Mass retained O 80 40 80 110 68 61arrow_forwardQ2 (a) A specific gravity test was performed on a sample of fine aggregate and produced the following results: Mass of sand (saturated surface dry) = 520g Mass of sand (oven dry) = 510g Mass of pycnometer with full of water = 1550g Mass of pycnometer with sand and water = 1900g i. Calculate the apparent specific gravity of the fine aggregate. ii. Calculate the gross apparent specific gravity of fine aggregate.arrow_forward

 Structural Analysis (10th Edition)Civil EngineeringISBN:9780134610672Author:Russell C. HibbelerPublisher:PEARSON
 Principles of Foundation Engineering (MindTap Cou...Civil EngineeringISBN:9781337705028Author:Braja M. Das, Nagaratnam SivakuganPublisher:Cengage Learning
 Fundamentals of Structural AnalysisCivil EngineeringISBN:9780073398006Author:Kenneth M. Leet Emeritus, Chia-Ming Uang, Joel LanningPublisher:McGraw-Hill Education
 Traffic and Highway EngineeringCivil EngineeringISBN:9781305156241Author:Garber, Nicholas J.Publisher:Cengage Learning