
Concept explainers
Videos
Cost Estimation: Simple and Multiple Regression Using a Spreadsheet (Appendix A)
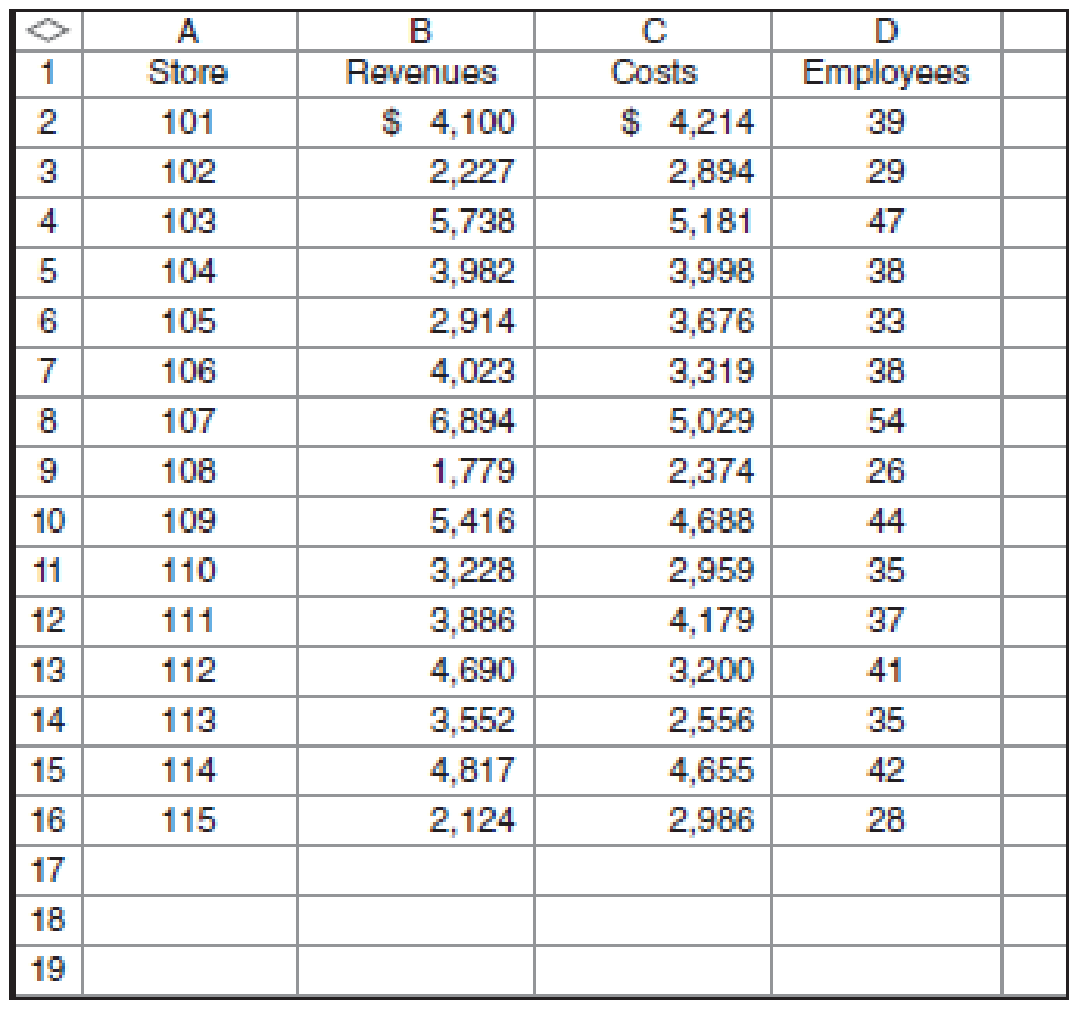
Recall the analysis for Davis Stores in Exercises 5-39, 5-40, and 5-41. During a discussion of those results, one of the managers suggests that number of employees might be better at explaining cost than store revenues. As a result of that suggestion, managers collected information on the number of employees and combined it with their original data.
Required
- a. Use the high-low method to estimate the fixed and variable portions of store costs based on employees.
- b. Use the results of your high-low analysis to estimate the cost for a store with 30 employees.
- c. Prepare a scattergraph between store cost and employees.
- d. Prepare an estimate of the cost of a store with 30 employees using the results from a simple regression of store cost on employees.
- e. Prepare an estimate of the cost of a store with revenues of $2.5 million and 30 employees using the results of a multiple regression of store costs on store revenues and employees.
- f. Comment on the results of the regression analyses in parts d and e. (Hint: Consider how the managers of Davis Stores might staff their stores and what this might mean for the data being used in the multiple regression analysis.)
a.
Use the high-low method to estimate the fixed and variable portions of store costs based on employees.
Explanation of Solution
High-low cost method:
High-low cost method helps in separating the fixed and variable cost from the total cost. It is calculated by comparing the highest and lowest level of activities and the cost of these activities.
Show the cost equation of fixed and variable cost with the overhead cost:
Thus, the cost equation is:
Working note 1:
Calculate the fixed cost:
Calculate the highest and lowest activity:
| Particular | Employees | Cost |
| Highest activity | 54 | $5,029 |
| Lowest activity | 26 | $2,374 |
Table: (1)
Working note 2:
Calculate the variable cost (unit) with the help of high-low cost method:
Working note 3:
Calculate the variable cost ($) with the help of high-low cost method:
b.
Use the results of your high-low analysis to estimate the cost for a store with 30 employees.
Explanation of Solution
Total cost of store:
Total cost of the store includes the fixed and variable cost of the production. It is calculated by the cost equation.
Estimate the cost for the store:
Thus, the estimated cost for the store is $2,753.
c.
Prepare a scatter graph between store cost and employees.
Explanation of Solution
Scatter graph:
Scatter graph shows the relationship between the cost and the activity. It shows the cost at various level of activity. It helps in finding the outlier in the data. So the management can eliminate it to make more effective decisions.
Prepare the scatter graph for store cost and employee:
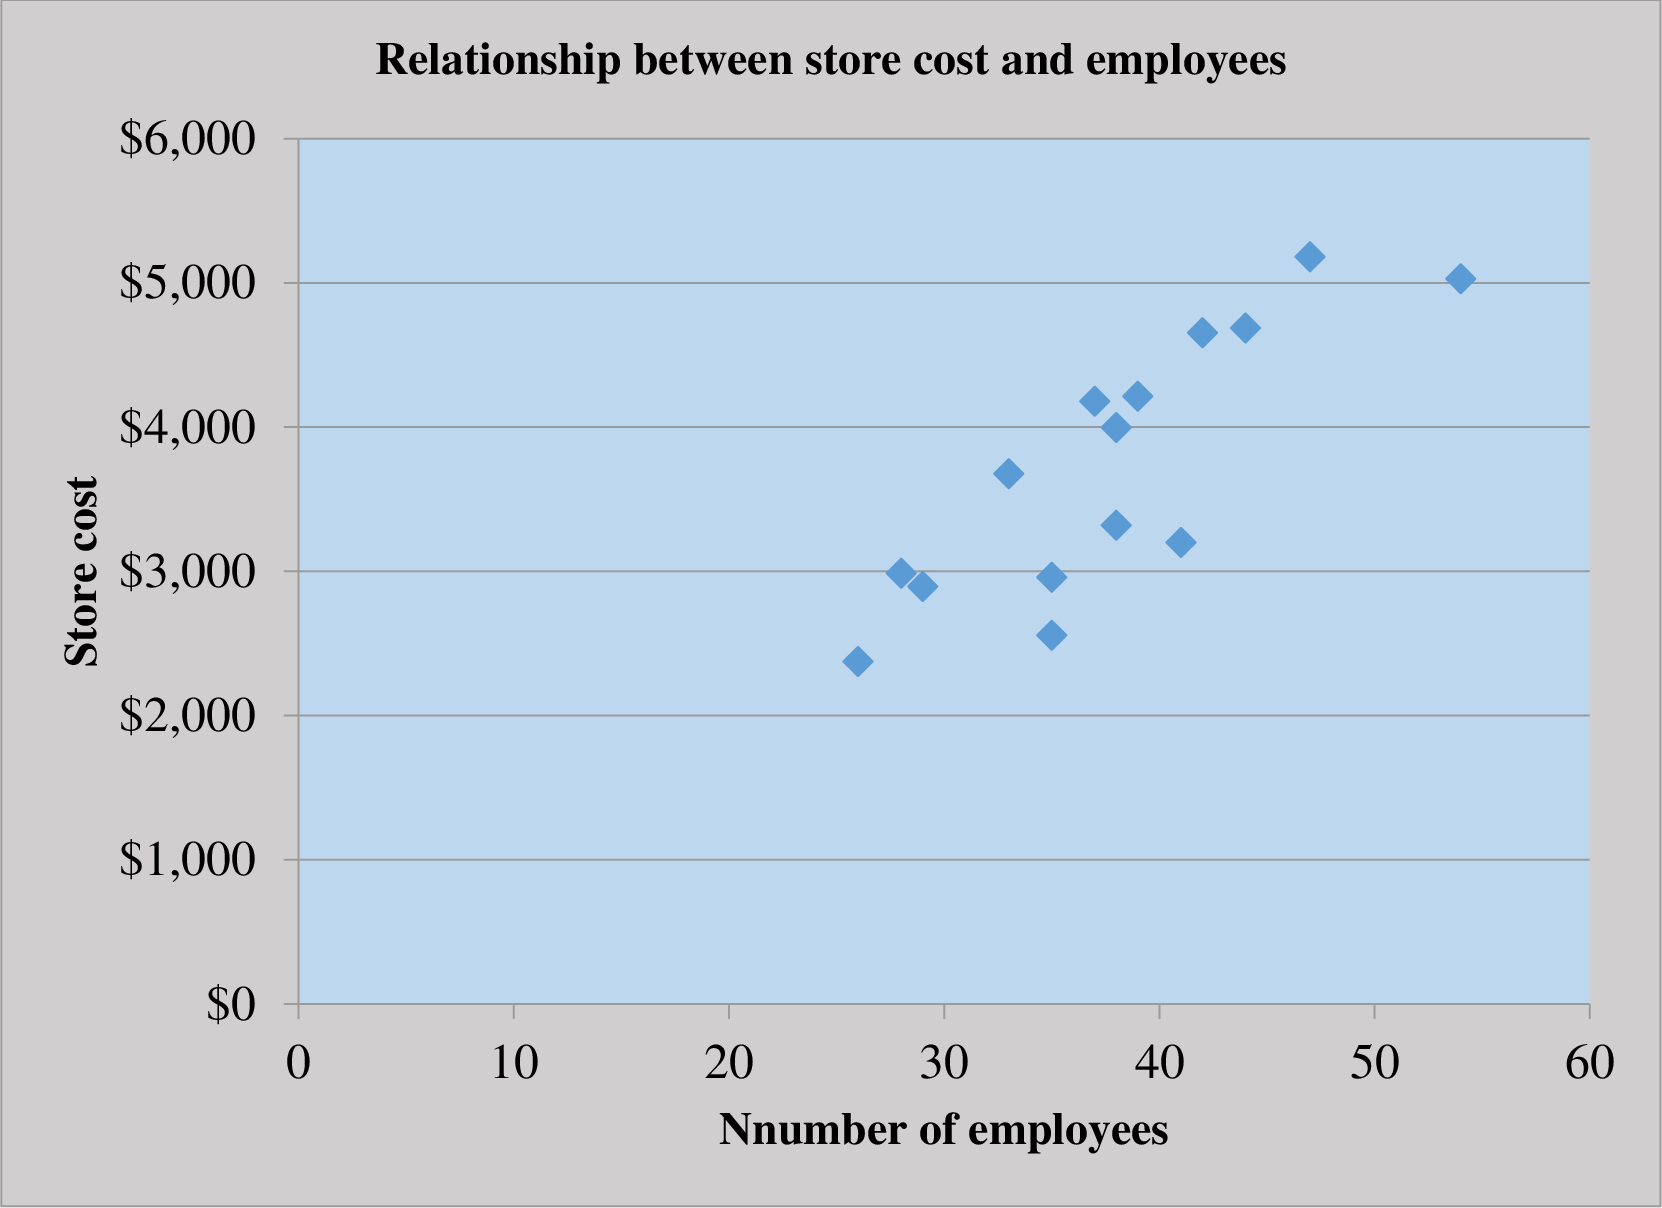
The scatter plot represents number of employees on the horizontal axis and the store cost on the vertical axis. The points on the scatter plot do not seem to form the linear pattern and there is not a healthy relationship as well.
d.
Prepare an estimate of the cost of a store with 30 employees using the results from a simple regression of store cost on employees.
Answer to Problem 60P
The store cost is $2,930.
Explanation of Solution
Cost equation:
Cost equation is a mathematical representation of the cost estimation at various level of activity. It is used by defining the fixed cost and variable cost per unit and then the variable cost per unit is multiplied by the given variable to calculate the relative cost.
Thus, the store cost is $2,930.
e.
Prepare an estimate of the cost of a store with revenues of $2.5 million and 30 employees using the results of a multiple regression of store costs on store revenues and employees.
Explanation of Solution
Multiple regressions:
Multiple regressions use two or more activities (variables) to establish the relationship between cost and activities:
Thus, the store cost is $2,935.8.
f.
Comment on the results of the regression analyses in parts d and e.
Explanation of Solution
Regression analysis:
Regression analysis is used to show the relationship between the cost and the activity. It is used to estimate the cost at various level of activity.
The most important step in the calculation of regression analysis is to establish a logical relationship between the cost and the activity. The activity (independent variable) is placed on the right-hand-side and the cost (dependant variable) is placed on the left-hand-side of the graph.
Comment on the results of the regression analyses:
In case of simple and multiple regressions, the both of the coefficients are not very significant. But the both the R2 are similar and significant. This kind of problem arises when two or more independent variables in a multiple regression analyses are related to each other.
In the given case, the number of employees and revenue are closely related.
Want to see more full solutions like this?
Chapter 5 Solutions
FUND. OF COST ACCOUNTING ACCESS >I<


- Evaluating selling and administrative cost allocations Gordon Gecco Furniture Company has two major product lines with the following characteristics: Commercial office furniture: Few large orders, little advertising support, shipments in full truckloads, and low handling complexity Home office furniture: Many small orders, large advertising support, shipments in partial truckloads, and high handling complexity The company produced the following profitability report for management: The selling and administrative expenses are allocated to the products on the basis of relative sales dollars. Evaluate the accuracy of this report and recommend an alternative approach.arrow_forwardRefer to Cornerstone Exercise 3.4 for data on Dohini Manufacturing Companys purchasing cost and number of purchase orders. The controller for Dohini Manufacturing ran regression on the data, and the coefficients shown by the regression program are: Required: 1. Construct the cost formula for the purchasing activity showing the fixed cost and the variable rate. 2. If Dohini Manufacturing Company estimates that next month will have 430 purchase orders, what is the total estimated purchasing cost for that month? (Round your answer to the nearest dollar.) 3. What if Dohini Manufacturing wants to estimate purchasing cost for the coming year and expects 5,340 purchase orders? What will estimated total purchasing cost be? (Round your answer to the nearest dollar.) What is the total fixed purchasing cost? Why doesnt it equal the fixed cost calculated in Requirement 1?arrow_forwardMethod of Least Squares, Predicting Cost for Different Time Periods from the One Used to Develop a Cost Formula Refer to the information for Farnsworth Company on the previous page. However, assume that Tracy has used the method of least squares on the receiving data and has gotten the following results: Required: 1. Using the results from the method of least squares, prepare a cost formula for the receiving activity. 2. Using the formula from Requirement 1, what is the predicted cost of receiving for a month in which 1,450 receiving orders are processed? (Note: Round your answer to the nearest dollar.) 3. Prepare a cost formula for the receiving activity for a quarter. Based on this formula, what is the predicted cost of receiving for a quarter in which 4,650 receiving orders are anticipated? Prepare a cost formula for the receiving activity for a year. Based on this formula, what is the predicted cost of receiving for a year in which 18,000 receiving orders are anticipated?arrow_forward
- Customers as a Cost Object Morrisom National Bank has requested an analysis of checking account profitability by customer type. Customers are categorized according to the size of their account: low balances, medium balances, and high balances. The activities associated with the three different customer categories and their associated annual costs are as follows: Additional data concerning the usage of the activities by the various customers are also provided: Required: (Note: Round answers to two decimal places.) 1. Calculate a cost per account per year by dividing the total cost of processing and maintaining checking accounts by the total number of accounts. What is the average fee per month that the bank should charge to cover the costs incurred because of checking accounts? 2. Calculate a cost per account by customer category by using activity rates. 3. Currently, the bank offers free checking to all of its customers. The interest revenues average 90 per account; however, the interest revenues earned per account by category are 80, 100, and 165 for the low-, medium-, and high-balance accounts, respectively. Calculate the average profit per account (average revenue minus average cost from Requirement 1). Then calculate the profit per account by using the revenue per customer type and the unit cost per customer type calculated in Requirement 2. 4. CONCEPTUAL CONNECTION After the analysis in Requirement 3, a vice president recommended eliminating the free checking feature for low-balance customers. The bank president expressed reluctance to do so, arguing that the low-balance customers more than made up for the loss through cross-sales. He presented a survey that showed that 50% of the customers would switch banks if a checking fee were imposed. Explain how you could verify the presidents argument by using ABC.arrow_forwardScattergraph, High-Low Method, and Predicting Cost for a Different Time Period from the One Used to Develop a Cost Formula Refer to the information for Farnsworth Company on the previous page. Required: 1. Prepare a scattergraph based on the 10 months of data. Does the relationship appear to be linear? 2. Using the high-low method, prepare a cost formula for the receiving activity. Using this formula, what is the predicted cost of receiving for a month in which 1,450 receiving orders are processed? 3. Prepare a cost formula for the receiving activity for a quarter. Based on this formula, what is the predicted cost of receiving for a quarter in which 4,650 receiving orders are anticipated? Prepare a cost formula for the receiving activity for a year. Based on this formula, what is the predicted cost of receiving for a year in which 18,000 receiving orders are anticipated? Use the following information for Problems 3-60 and 3-61: Farnsworth Company has gathered data on its overhead activities and associated costs for the past 10 months. Tracy Heppler, a member of the controllers department, has convinced management that overhead costs can be better estimated and controlled if the fixed and variable components of each overhead activity are known. One such activity is receiving raw materials (unloading incoming goods, counting goods, and inspecting goods), which she believes is driven by the number of receiving orders. Ten months of data have been gathered for the receiving activity and are as follows:arrow_forwardDifferential Costing As pointed out earlier in Heres the Real Kicker, Kicker changed banks a couple of years ago because the loan officer at its bank moved out of state. Kicker saw that as an opportunity to take bids for its banking business and to fine-tune the banking services it was using. This problem uses that situation as the underlying scenario but uses three banks: FirstBank, Community Bank, and RegionalOne Bank. A set of representative data was presented to each bank for the purpose of preparing a bid. The data are as follows: Checking accounts needed: 6 Checks per month: 2,000 Foreign debits/credits on checking accounts per month: 200 Deposits per month: 300 Returned checks: 25 per month Credit card charges per month: 4,000 Wire transfers per month: 100, of which 60 are to foreign bank accounts Monthly credit needs (line of credit availability and cost): 100,000 average monthly usage These are overall totals for the six accounts during a month. Internet banking services? Knowledgeable loan officer? Responsiveness of bank? FirstBank Bid: Checking accounts: 5 monthly maintenance fee per account 0.10 foreign debit/credit 0.50 earned for each deposit 3 per returned check Credit card fees: 0.50 per item Wire transfers: 15 to domestic bank accounts, 50 to foreign bank accounts Line of credit: Yes, this amount is available, interest charged at prime plus 2%, subject to a 6% minimum interest rate Internet banking services? Yes, full online banking available: 15 one-time setup fee for each account 20 monthly fee for software module The loan officer assigned to the potential Kicker account had 10 years of experience with medium to large business banking and showed an understanding of the audio industry. Community Bank Bid: Checking accounts: No fees for the accounts, and no credits earned on deposits 2.00 per returned check Credit card fees: 0.50 per item, 7 per batch processed. Only manual processing was available, and Kicker estimated 20 batches per month Wire transfers: 30 per wire transfer Line of credit: Yes, this amount is available: interest charged at prime plus 2% subject to a 7% minimum interest rate Internet banking services? Not currently, but within the next 6 months The loan officer assigned to the potential Kicker account had 4 years of experience with medium to large business banking, none of which pertained to the audio industry. RegionalOne Bank Bid: Checking accounts: 5 monthly maintenance fee per account to be waived for Kicker 0.20 foreign debit/credit 0.30 earned for each deposit 3.80 per returned check Credit card fees: 0.50 per item Wire transfers: 10 to domestic bank accounts, 55 to foreign bank accounts Line of credit: Yes, this amount is available: interest charged at prime plus 2% subject to a 6.5% minimum interest rate Internet banking services? Yes, full online banking available: one-time setup fee for each account waived for Kicker 20 monthly fee for software module The loan officer assigned to the potential Kicker account had 2 years of experience with large business banking. Another branch of the bank had expertise in the audio industry and would be willing to help as needed. This bank was the first one to submit a bid. Required: 1. Calculate the predicted monthly cost of banking with each bank. Round answers to the nearest dollar. 2. CONCEPTUAL CONNECTION Suppose Kicker felt that full online Internet banking was critical. How would that affect your analysis from Requirement 1? How would you incorporate the subjective factors (e.g., experience, access to expertise)?arrow_forward
- The following information is from Good Read Books. Good Read is a regional book store with three regional stores. The May income statement for all stores is shown. A. Comment on the operating income results for each store. B. Now assume the costs allocated from corporate is an uncontrollable cost for each store. How does this change your assessment of each store?arrow_forwardUse the following information for Exercises 2-47 through 2-49. Jasper Company provided the following information for last year: Last year, beginning and ending inventories of work in process and finished goods equaled zero. Exercise 2-49 Income Statement Refer to the information for Jasper Company on the previous page. Required: 1. Prepare an income statement for Jasper for last year. Calculate the percentage of sales for each line item on the income statement. (Note: Round percentages to the nearest tenth of a percent.) 2. CONCEPTUAL CONNECTION Briefly explain how a manager could use the income statement created for Requirement 1 to better control costs.arrow_forwardUse the following information to answer the questions that follow. A. Calculate the operating income percentage for each of the stores. Comment on how your analysis has changed for each store. B. Perform a vertical analysis for each store. Based on your analysis, what accounts would you want to investigate further? How might management utilize this information? C. Which method of analysis (using a dollar value or percentage) is most relevant and/or useful? Explain.arrow_forward
- Rizzo Goal Inc. produces and sells hockey equipment, often custom made for online orders. The company has the following performance metrics on its balanced scorecard: days from ordered to delivered, number of shipping errors, customer retention rate, and market share. A measure map illustrates that the days from ordered to delivered and the number of shipping errors are both expected to directly affect the customer retention rate, which affects market share. Additional internal analysis finds that: Every shipping error over three shipping errors per month reduces the customer retention rate by 1.5%. On average, each day above three days from ordered to delivered yields a reduction in the customer retention rate of 1%. Each day before three days from order to delivery yields an increase in the customer retention rate of 1%, on average. Rizzo Goal Inc.s current customer retention rate is 60%. The company estimates that for every 1% increase or decrease in the customer retention rate, market share changes 0.5% in the same direction. Rizzo Goal Inc.s current market share is 21.4%. Ignoring any other factors, if the company has six shipping errors this month and an average of 3.5 days from ordered to delivered, determine (a) the new customer retention rate and (b) the new market share that Rizzo Goal Inc. expects to have.arrow_forwardExplaining why companies use performance evaluation systems Financial performance is measured in many ways. Requirements 1. Explain the difference between lag and lead indicators. 2. The following is a list of financial measures. Indicate whether each is a lag or a lead indicator: a. Income statement shows net income of $100,000 b. Listing of next week’s orders of $50,000 c. Trend showing that average hits on the redesigned Web site are increasing at 5% per week d. Price sheet from vendor reflecting that cost per pound of sugar for the next month is $2 e. Contract signed last month with large retail store that guarantees a minimum shelf space for Grandpa’s Overloaded Chocolate Cookies for the next yeararrow_forwardMatching graphs with descriptions of cost and revenue behavior. (D. Green, adapted) Given here are a number of graphs. The horizontal axis of each graph represents the units produced over the year, and the vertical axis represents total cost or revenues. Indicate by number which graph best fits the situation or item described (a–h). Some graphs may be used more than once; some may not apply to any of the situations. Direct material costs Supervisors’ salaries for one shift and two shifts A cost-volume-profit graph Mixed costs—for example, car rental fixed charge plus a rate per mile driven Depreciation of plant, computed on a straight-line basis Data supporting the use of a variable-cost rate, such as manufacturing labor cost of $14 per unit produced Incentive bonus plan that pays managers $0.10 for every unit produced above some level of production Interest expense on $2 million borrowed at a fixed rate of interestarrow_forward
 Managerial Accounting: The Cornerstone of Busines...AccountingISBN:9781337115773Author:Maryanne M. Mowen, Don R. Hansen, Dan L. HeitgerPublisher:Cengage Learning
 Managerial AccountingAccountingISBN:9781337912020Author:Carl Warren, Ph.d. Cma William B. TaylerPublisher:South-Western College Pub
 Cornerstones of Cost Management (Cornerstones Ser...AccountingISBN:9781305970663Author:Don R. Hansen, Maryanne M. MowenPublisher:Cengage Learning
 Principles of Accounting Volume 2AccountingISBN:9781947172609Author:OpenStaxPublisher:OpenStax College
 Financial And Managerial AccountingAccountingISBN:9781337902663Author:WARREN, Carl S.Publisher:Cengage Learning,