
To find: The different type of model for given data and to decipher the best fit model for the data.
The cubic model best fit the data.
Given information: A data is given.
| X | 3 | 8 | 15 | 21 |
| y | 7 | 11 | 26 | 44 |
Concept used: Polynomial functions can be constant, linear, quadratic, cubic and so on. Graphing calculator can be used to determine functions that model data.
Explanation:
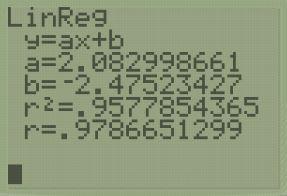
Using the LinReg function, the linear model for the data values is:
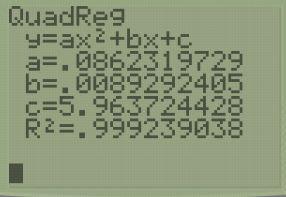
Using the QuadReg function, the quadratic model for the data values is:
Using the CubicReg function, the quadratic model for the data values is:
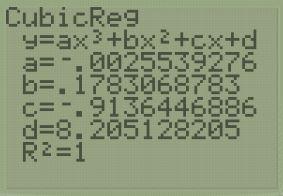
Based on this calculation, the model that best the data is the cubic model.
Chapter 5 Solutions
High School Math 2015 Common Core Algebra 2 Student Edition Grades 10/11

 Algebra and Trigonometry (6th Edition)AlgebraISBN:9780134463216Author:Robert F. BlitzerPublisher:PEARSON
 Contemporary Abstract AlgebraAlgebraISBN:9781305657960Author:Joseph GallianPublisher:Cengage Learning
 Linear Algebra: A Modern IntroductionAlgebraISBN:9781285463247Author:David PoolePublisher:Cengage Learning
 Algebra And Trigonometry (11th Edition)AlgebraISBN:9780135163078Author:Michael SullivanPublisher:PEARSON
 Introduction to Linear Algebra, Fifth EditionAlgebraISBN:9780980232776Author:Gilbert StrangPublisher:Wellesley-Cambridge Press
 College Algebra (Collegiate Math)AlgebraISBN:9780077836344Author:Julie Miller, Donna GerkenPublisher:McGraw-Hill Education