
To Describe: The shape of the graph of each cubic function including end behaviour, turning points, and increasing/decreasing intervals.
The graph's end behaviour is rises to the left and falls to the right.
There are
Increasing on:
Decreasing on:
Given:
Explanation:
Given the function
To create a table of values, substitute values to the equation.
Substitute
Substitute
Substitute
Substitute
Substitute
Graph of the function is as:
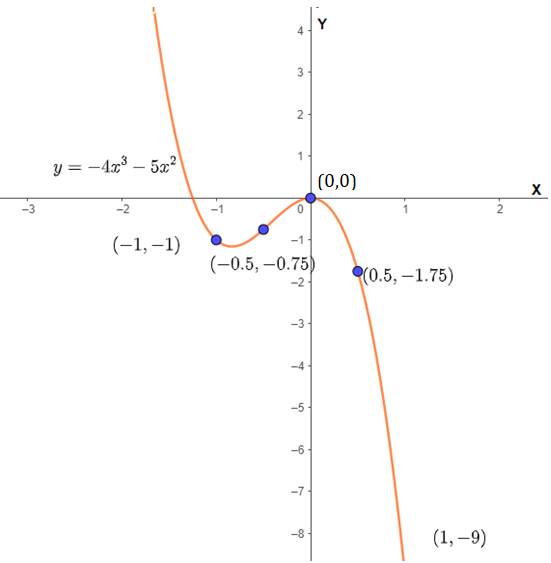
Find the end behaviour of
The leading coefficient in a polynomial is the coefficient of the leading term which is
Since the degree is odd, the ends of the function will point in the opposite directions.
Since the leading coefficient is negative, the graph falls to the right.
The graph's end behaviour is rises to the left and falls to the right.
To find the turning points, set
Set the equation to
Thus, there are
Determine the interval of increasing/decreasing:
By using the graph, the graph is
Increasing on:
Decreasing on:
Chapter 5 Solutions
High School Math 2015 Common Core Algebra 2 Student Edition Grades 10/11

 Algebra and Trigonometry (6th Edition)AlgebraISBN:9780134463216Author:Robert F. BlitzerPublisher:PEARSON
 Contemporary Abstract AlgebraAlgebraISBN:9781305657960Author:Joseph GallianPublisher:Cengage Learning
 Linear Algebra: A Modern IntroductionAlgebraISBN:9781285463247Author:David PoolePublisher:Cengage Learning
 Algebra And Trigonometry (11th Edition)AlgebraISBN:9780135163078Author:Michael SullivanPublisher:PEARSON
 Introduction to Linear Algebra, Fifth EditionAlgebraISBN:9780980232776Author:Gilbert StrangPublisher:Wellesley-Cambridge Press
 College Algebra (Collegiate Math)AlgebraISBN:9780077836344Author:Julie Miller, Donna GerkenPublisher:McGraw-Hill Education