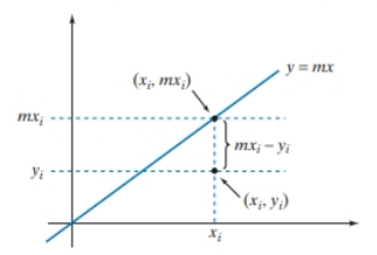
Refer to Figure 13 of this section. The least-s quart’s line for these data is the line y = m x that fits the data best, in that the sum of the squares of the vertical distances between the line and the data points is minimal. We want to minimize the sum ( m x 1 − y 1 ) 2 + ( m x 2 − y 2 ) 2 + ⋯ + ( m x 5 − y 5 ) 2 . In vector notation, to minimize the um means to find the scalar in such that ‖ m x → − y → ‖ 2 is minimal. Arguing geometrically, explain how you can find m. Use the accompanying sketch, which is not drawn to scale. Find m numerically, and explain the relationship between m and the correlation coefficient r. You may find the following information helpful: x → ⋅ y → = 4182.9 , ‖ x → ‖ ≈ 198.53 , ‖ y → ‖ ≈ 21.539 To check whether your solution m is reasonable, draw the line y = m x in Figure 13. (A more thorough discussion of least-squares approximations will follow in Section 5.4.)
Refer to Figure 13 of this section. The least-s quart’s line for these data is the line y = m x that fits the data best, in that the sum of the squares of the vertical distances between the line and the data points is minimal. We want to minimize the sum ( m x 1 − y 1 ) 2 + ( m x 2 − y 2 ) 2 + ⋯ + ( m x 5 − y 5 ) 2 . In vector notation, to minimize the um means to find the scalar in such that ‖ m x → − y → ‖ 2 is minimal. Arguing geometrically, explain how you can find m. Use the accompanying sketch, which is not drawn to scale. Find m numerically, and explain the relationship between m and the correlation coefficient r. You may find the following information helpful: x → ⋅ y → = 4182.9 , ‖ x → ‖ ≈ 198.53 , ‖ y → ‖ ≈ 21.539 To check whether your solution m is reasonable, draw the line y = m x in Figure 13. (A more thorough discussion of least-squares approximations will follow in Section 5.4.)
Solution Summary: The author explains how to calculate the slope of the given line and find out the value of m.
Refer to Figure 13 of this section. The least-s quart’s line for these data is the line
y
=
m
x
that fits the data best, in that the sum of the squares of the vertical distances between the line and the data points is minimal. We want to minimize the sum
(
m
x
1
−
y
1
)
2
+
(
m
x
2
−
y
2
)
2
+
⋯
+
(
m
x
5
−
y
5
)
2
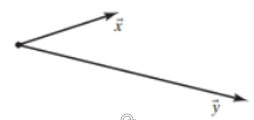
. In vector notation, to minimize the um means to find the scalar in such that
‖
m
x
→
−
y
→
‖
2
is minimal. Arguing geometrically, explain how you can find m. Use the accompanying sketch, which is not drawn to scale.
Find m numerically, and explain the relationship between m and the correlation coefficient r. You may find the following information helpful:
x
→
⋅
y
→
=
4182.9
,
‖
x
→
‖
≈
198.53
,
‖
y
→
‖
≈
21.539
To check whether your solution m is reasonable, draw the line
y
=
m
x
in Figure 13. (A more thorough discussion of least-squares approximations will follow in Section 5.4.)
Definition Definition Statistical measure used to assess the strength and direction of relationships between two variables. Correlation coefficients range between -1 and 1. A coefficient value of 0 indicates that there is no relationship between the variables, whereas a -1 or 1 indicates that there is a perfect negative or positive correlation.
Need a deep-dive on the concept behind this application? Look no further. Learn more about this topic, algebra and related others by exploring similar questions and additional content below.
Area of a Rectangle, Triangle, Circle & Sector, Trapezoid, Square, Parallelogram, Rhombus, Geometry; Author: The Organic Chemistry Tutor;https://www.youtube.com/watch?v=JnLDmw3bbuw;License: Standard YouTube License, CC-BY


 Algebra & Trigonometry with Analytic GeometryAlgebraISBN:9781133382119Author:SwokowskiPublisher:Cengage
 Mathematics For Machine TechnologyAdvanced MathISBN:9781337798310Author:Peterson, John.Publisher:Cengage Learning,
 Algebra: Structure And Method, Book 1AlgebraISBN:9780395977224Author:Richard G. Brown, Mary P. Dolciani, Robert H. Sorgenfrey, William L. ColePublisher:McDougal Littell