Concept explainers
Videos
A Population Model The population (in millions) of a state
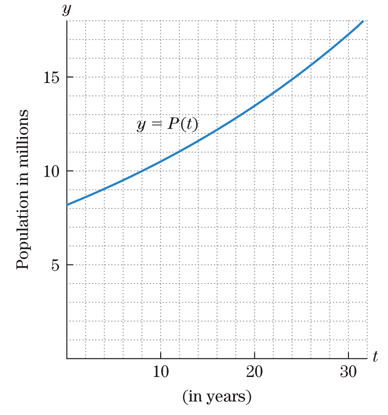
Figure
a. What is the population in
b. When is the population
c. How fast is the population growing in
d. When is the population growing at the rate of
Want to see the full answer?
Check out a sample textbook solution
Chapter 5 Solutions
Pearson eText for Calculus & Its Applications -- Instant Access (Pearson+)


- The table shows the mid-year populations (in millions) of five countries in 2015 and the projected populations (in millions) for the year 2025. (a) Find the exponential growth or decay model y=aebt or y=aebt for the population of each country by letting t=15 correspond to 2015. Use the model to predict the population of each country in 2035. (b) You can see that the populations of the United States and the United Kingdom are growing at different rates. What constant in the equation y=aebt gives the growth rate? Discuss the relationship between the different growth rates and the magnitude of the constant.arrow_forwardWhat is the y -intercept of the logistic growth model y=c1+aerx ? Show the steps for calculation. What does this point tell us about the population?arrow_forwardPopulation The table shows the mid-year populations (in millions) of five countries in 2015 and the projected populations (in millions) for the year 2025. (a) Find the exponential growth or decay model y=aebt or y=aebt for the population of each country by letting t=15 correspond to 2015. Use the model to predict the population of each country in 2035. (b) You can see that the populations of the United States and the United Kingdom are growing at different rates. What constant in the equation y=aebt gives the growth rate? Discuss the relationship between the different growth rates and the magnitude of the constant.arrow_forward
- The fox population in a certain region has an annualgrowth rate of 9 per year. In the year 2012, therewere 23,900 fox counted in the area. What is the foxpopulation predicted to be in the year 2020 ?arrow_forwardEastern Pacific Yellowfin Tuna Studies to fit a logistic model to the Eastern Pacific yellowfin tuna population have yielded N=1481+36e2.61t where t is measured in years and N is measured in thousands of tons of fish. a. What is the r value for the Eastern Pacific yellowfin tuna? b. What is the carrying capacity K for the Eastern Pacific yellowfin tuna? c. What is the optimum yield level? d. Use your calculator to graph N versus t. e. At what time was the population growing the most rapidly?arrow_forwardSuppose that the initial size of a population is n0 and the population grows exponentially. Let n(t) be the size of the population at time t. (a) Write a formula for n(t) in terms of the doubling time a. (b) Write a formula for n(t) in terms of the relative growth rate r.arrow_forward
 Trigonometry (MindTap Course List)TrigonometryISBN:9781337278461Author:Ron LarsonPublisher:Cengage Learning
 Algebra & Trigonometry with Analytic GeometryAlgebraISBN:9781133382119Author:SwokowskiPublisher:Cengage
 College AlgebraAlgebraISBN:9781305115545Author:James Stewart, Lothar Redlin, Saleem WatsonPublisher:Cengage Learning
 Glencoe Algebra 1, Student Edition, 9780079039897...AlgebraISBN:9780079039897Author:CarterPublisher:McGraw Hill