Concept explainers
Videos
Temperature of a Rod When a rod of molten steel with a temperature of
The graph of this function is shown in Fig.2
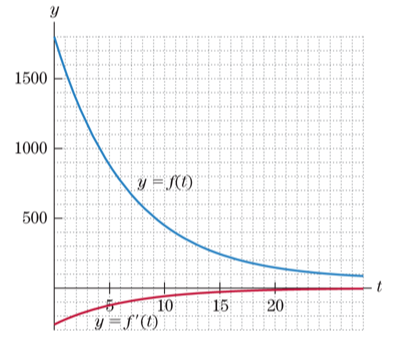
Figure2
a. What is the temperature of the rod after
b. At what rate is the temperature of the rod changing after
c. Approximately when is the temperature of the rod
d. Approximately when is the rod cooling at the rate of
Want to see the full answer?
Check out a sample textbook solution
Chapter 5 Solutions
Pearson eText for Calculus & Its Applications -- Instant Access (Pearson+)


- Ceramics When the temperature of a pot in a kiln is 1200, an artist turns off the heat and leaves the pot to cool at a controlled rate of 18 per hour. Express the temperature of the pot in degrees Celsius as a function of the time t in hours since the kiln was turned off.arrow_forwardBird Population The graph shows the population of a rare species of bird, where t represents years since 2009 and n(t) is measured in thousands. a Find a function that models the bird population at time t in the form n(t)=n0ert. b What is the bird population expected to be in the year 2020?arrow_forwardLet f be a function with constant rate of change. Then a f is a ________ function and f is of the form fx = ______x ________. b The graph of f is a __________.arrow_forward
- Earthquake the graph shows the vertical acceleration of the Ground from the 1994 Northridge earthquake in Los Angles, as measured by a seismograph. (Here t represents the time in seconds.) (a) At what time t did the earthquake first make noticeable movement of the Earth? (b) At what time t did the earthquakes seem to end? (c) At what time t was the maximum intensity of the earthquake list reachedarrow_forwardMarine Fishery One class of models for population growth rates in marine fisheries assumes that the harvest from fishing is proportional to the population size. For one such model, we have G=0.3n(1n2)0.1n Here G is the growth rate of the population, in millions of tons of fish per year, and n is the population size, in millions of tons of fish. a.Make a graph of G versus n. include values of n up to 1.5 million tons. b.Use functional notation to express the growth rate if the population size is 0.24 million tons, and then calculate that value. c. Calculate G1.42 and explain in practical terms what your answer means. d.At what population size is the growth rate the largest?arrow_forwardTitanic At 2:00 p.m. on April 11, 1912, the Titanic left Cobh, Ireland, on her voyage to New York City. At 11:40 p.m. on April 14, the Titanic struck an iceberg and sank, having covered only about 2100 miles of the approximately 3400-mile trip. (a) What was the total duration of the voyage in hours? (b) What was the average speed in miles per hour? (c) Write a function relating the distance of the Titanic from New York City and the number of hours traveled. Find the domain and range of the function. (d) Graph the function in part (c).arrow_forward
 College Algebra (MindTap Course List)AlgebraISBN:9781305652231Author:R. David Gustafson, Jeff HughesPublisher:Cengage Learning
 Algebra & Trigonometry with Analytic GeometryAlgebraISBN:9781133382119Author:SwokowskiPublisher:Cengage
 College AlgebraAlgebraISBN:9781305115545Author:James Stewart, Lothar Redlin, Saleem WatsonPublisher:Cengage Learning
 Functions and Change: A Modeling Approach to Coll...AlgebraISBN:9781337111348Author:Bruce Crauder, Benny Evans, Alan NoellPublisher:Cengage Learning
 Algebra and Trigonometry (MindTap Course List)AlgebraISBN:9781305071742Author:James Stewart, Lothar Redlin, Saleem WatsonPublisher:Cengage Learning