
An Introduction to Statistical Methods and Data Analysis
7th Edition
ISBN: 9781305269477
Author: R. Lyman Ott, Micheal T. Longnecker
Publisher: Cengage Learning
expand_more
expand_more
format_list_bulleted
Videos
Textbook Question
Chapter 5.12, Problem 40E
Refer to Exercise 5.39.
- a. Does the normality of the data appear to be valid?
- b. How close to the true value were your bounds on the p-value?
- c. Is there a contradiction between the
interval estimate of μ and the conclusion reached by your test of the hypotheses?
5.39 A consumer testing agency wants to evaluate the claim made by a manufacturer of discount tires. The manufacturer claims that its tires can be driven at least 35,000 miles before wearing out. To determine the average number of miles that can be obtained from the manufacturer’s tires, the agency randomly selects 60 tires from the manufacturer’s warehouse and places the tires on 15 cars driven by test drivers on a 2-mile oval track. The number of miles driven (in thousands of miles) until the tires are determined to be worn out is given in the following table.
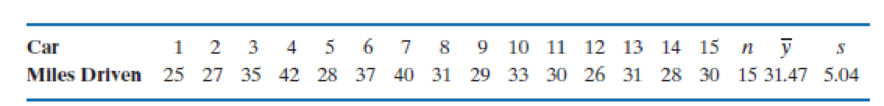
- a. Place a 99% confidence interval on the average number of miles driven, μ, prior to the tires wearing out.
- b. Is there significant evidence (α − .01) that the manufacturer’s claim is false? What is the level of significance of your test? Interpret your findings.
Expert Solution & Answer

Trending nowThis is a popular solution!

Students have asked these similar questions
A lab technician is tested for her consistency by making multiple measurements of the cholesterol level in one blood sample. The target precision is a standard deviation of 1 mg/dL or less. If 18 measurements are taken and the standard deviation is 2 mg/dL, is there enough evidence to support the claim that her standard deviation is greater than the target, at α= .01?
Group of answer choices
No, since the χ2 test value 34.00 is less than the critical value 34.805.
Yes, since the χ2 test value 68.000 is greater than the critical value 34.805.
No, since the χ2 test value 34.00 is greater than the critical value 33.409.
Yes, since the χ2 test value 68.000 is greater than the critical value 33.409.
A newspaper article reported that people spend a mean of 6 hours per day watching TV, with a standard deviation of 2.0 hours. A psychologist would like to conduct interviews with the 20% of the population who spend the most time watching TV. She assumes that the daily time people spend watching TV is normally distributed. At least how many hours of daily TV watching are necessary for a person to be eligible for the interview? Carry your intermediate computations to at least four decimal places. Round your answer to one decimal place.
The united States ranks ninth in the world in per capita chocolate consumption; the aver- age American eats 9.5 pounds of chocolate annually (Forbes, July 22, 2015). Suppose you are curious whether chocolate consumption is higher in Hershey, Pennsylvania, the location of The Hershey Company’s corporate headquarters. A sample of 36 individuals from the Hershey area showed a sample mean annual consumption of 10.05 pounds and a standard devi- ation of s = 1.5 pounds. using α = 0.05, do the sample results support the conclusion that mean annual consumption of chocolate is higher in Hershey than it is throughout the united States?
Chapter 5 Solutions
An Introduction to Statistical Methods and Data Analysis
Ch. 5.12 - The county government in a city that is dominated...Ch. 5.12 - In the research study on percentage of calories...Ch. 5.12 - Face masks used by firefighters often fail by...Ch. 5.12 - Refer to Exercise 5.3. Describe a process to...Ch. 5.12 - A company that manufacturers coffee for use in...Ch. 5.12 - Refer to Exercise 5.5. The engineer in charge of...Ch. 5.12 - Refer to Exercise 5.5. Because the company is...Ch. 5.12 - As part of the recruitment of new businesses, the...Ch. 5.12 - A program to reduce recidivism has been in effect...Ch. 5.12 - The susceptibility of the root stocks of a variety...
Ch. 5.12 - Prob. 11ECh. 5.12 - In any given situation, if the level of confidence...Ch. 5.12 - A biologist wishes to estimate the effect of an...Ch. 5.12 - Refer to Exercise 5.14. Suppose the mayors staff...Ch. 5.12 - Refer to Exercise 5.14. Suppose the mayors staff...Ch. 5.12 - A study is designed to test the hypotheses H0: ...Ch. 5.12 - Refer to Exercise 5.16. Graph the power curve for...Ch. 5.12 - A study was conducted of 90 adult male patients...Ch. 5.12 - Prob. 22ECh. 5.12 - A national agency sets recommended daily dietary...Ch. 5.12 - To evaluate the success of a 1-year experimental...Ch. 5.12 - Refer to Exercise 5.24. Suppose a random sample of...Ch. 5.12 - The administrator of a nursing home would like to...Ch. 5.12 - The vulnerability of inshore environments to...Ch. 5.12 - The RD department of a paint company has developed...Ch. 5.12 - Prob. 29ECh. 5.12 - A concern to public health officials is whether a...Ch. 5.12 - Prob. 31ECh. 5.12 - Prob. 32ECh. 5.12 - Prob. 33ECh. 5.12 - Provide the rejection region based on a t-test...Ch. 5.12 - A study was designed to evaluate whether the...Ch. 5.12 -
The ability to read rapidly and simultaneously...Ch. 5.12 - Refer to Exercise 5.36. Using the reading...Ch. 5.12 -
Refer to Exercise 5.36.
Does there appear to be a...Ch. 5.12 - A consumer testing agency wants to evaluate the...Ch. 5.12 -
Refer to Exercise 5.39.
Does the normality of the...Ch. 5.12 - The amount of sewage and industrial pollutants...Ch. 5.12 - A dealer in recycled paper places empty trailers...Ch. 5.12 - Prob. 47ECh. 5.12 - Prob. 48ECh. 5.12 - Prob. 49ECh. 5.12 - Prob. 50ECh. 5.12 - Prob. 51ECh. 5.12 - Prob. 52ECh. 5.12 - Prob. 53ECh. 5.12 - Prob. 54ECh. 5.12 - Prob. 55ECh. 5.12 - Prob. 56ECh. 5.12 - Prob. 57SECh. 5.12 - The concentration of mercury in a lake has been...Ch. 5.12 -
In a standard dissolution test for tablets of a...Ch. 5.12 - Prob. 60SECh. 5.12 -
Over the past 5 years, the mean time for a...Ch. 5.12 - If a new process for mining copper is to be put...Ch. 5.12 - Prob. 63SECh. 5.12 - Prob. 64SECh. 5.12 - Prob. 65SECh. 5.12 - Prob. 66SECh. 5.12 - Prob. 67SECh. 5.12 - Prob. 68SECh. 5.12 - Prob. 69SECh. 5.12 - Prob. 70SECh. 5.12 - Prob. 71SECh. 5.12 - Prob. 73SECh. 5.12 - Prob. 74SECh. 5.12 - Prob. 75SECh. 5.12 - Prob. 76SE
Knowledge Booster


Learn more about
Need a deep-dive on the concept behind this application? Look no further. Learn more about this topic, statistics and related others by exploring similar questions and additional content below.Similar questions
- Dr. Castillejo feels that the maximum pulse rate during the run is a good predictor in explaining the oxygen consumption in the blood stream. He asserts that if the pulse rate at the end of the run increased, then the oxygen consumption will also increase, hence his/her heart is functioning well. Based on the R commanderoutput below, check if the data on oxygen consumption and maximum pulse rate (from 152 bpm to 196bpm) support Dr. Castillejo’s assertion.arrow_forwardAn industrial sewing machine uses ball bearings that are targeted to have a diameter of 0.75 inch. The lower and upper specification limits under which the ball bearings can operate are 0.73 inch and 0.77 inch, respectively. Past experience has indicated that the actual diameter of the ball bearings is approximately normally distributed, with a mean of 0.754 inch and a standard deviation of 0.005 inch. Type calculations and/or use Excel functions, including the explicit arguments for each function, in answering these questions. a) What proportion of the ball bearings produced meet the design requirements? b) Of 1000 bearings , how many are expected to be too large to function in the sewing machine? c) What diameter represents the 80th percentile of the bearings produced by this machine?arrow_forwardThe American Milk Association is claiming that men drink more milk than women. If a sample of 45 men drink on average 26 oz of milk a day with a standard deviation of 5oz. A sample of 40 women drink on average 24oz of milk a day with a standard deviation of 3oz. At the .10 significance level using (z or t value of 2.26), can we conclude that men drink more milk than women? Group of answer choices REJECT Ho; We CANNOT prove the claim that Men drink more milk than Women. DO NOT REJECT Ho; We CAN prove the claim that Men drink more milk than Women. REJECT Ho; We CAN prove the claim that Men drink more milk than Women. DO NOT REJECT Ho; We CANNOT prove the claim that Men drink more milk than Women. Flag this Questionarrow_forward
- A machine fills 12-ounce bottles with soda. For the machine to function properly, the standard deviation of the sample must be less than or equal to 0.02 ounce. A sample of 8 bottles is selected, and the number of ounces of soda in each bottle is given. At alpha=0.05, can you reject the claim that the machine is functioning properly? Justify your answer. (Assume that the variables are approximately normally distributed). 12.04 11.91 11.91 11.91 11.91 11.97 12.01 12.06arrow_forwardWhat type of statistical test are you conducting if h1 states that the parameter is greater than the value claimed in h0? a) left-tailed b) right-tailed c) two-tailed d) dove-tailedarrow_forwardThe contingency table shows the results of a random sample of former smokers by the number of times they tried to quit smoking before they were habit-free and gender. At α=0.10, can you conclude that the number of times they tried to quit before they were habit-free is related to gender? Perform the indicated chi-square independence test by completing parts (a) through (e) below.arrow_forward
- A veterinarian claims that the mean weight of adult German shepherd dogs is 75 pounds. The test statistic is -2.01 when a researcher applied hypothesis test to test a veterinarian's claim at ?=0.05α=0.05. Find the critical value(s) and state the conclusion.arrow_forwardA fisheries biologist collected a random sample of fish from a lake and conducted a chi-square goodness-of-fit test to see if the distribution of fish changed over time. The table below shows the distribution of fish that were put into the lake when it was originally stocked. Fish Type Trout Bass Perch Sunfish Catfish Percent 25% 25% 20% 15% 15% The biologist found evidence to reject the null hypothesis in favor of the alternative hypothesis. Which of the following represents the alternative hypothesis of the test?arrow_forwardAre the following results significant at α=.01? F(2,27) =10.56, p=.02 Yes No 2. A large F-ratio (or a significant result) is the result of: a small amount variability within the groups and a large amount of variability between the groups a large amount variability within the groups and a small amount of variability between the groups a large amount variability within the groups and a large amount of variability between the groups a small amount variability within the groups and a small amount of variability between the groupsarrow_forward
- To study the effect of alloying on the resistance of electric wires, an engineer plans to measure the resis-tance of n1 = 35 standard wires and n2 = 45 alloyed wires. If it can be assumed that σ1 = 0.004 ohm andσ2 = 0.005 ohm for such data, what can she assert with98% confidence about the maximum error if she usesx1 − x2 as an estimate of μ1 − μ2? (Hint: Use the result ofExercise 8.)arrow_forwardIn a certain survey, 507 people chose to respond to this question: "Should passwords be replaced with biometric security (fingerprints, etc)?" Among the respondents, 55% said "yes." We want to test the claim that more than half of the population believes that passwords should be replaced with biometric security. Complete parts (a) through (d) below. a. Are any of the three requirements violated? Can a test about a population proportion using the normal approximation method be used? A. The conditions npgreater than or equals5 and nqgreater than or equals5 are not satisfied, so a test about a population proportion using the normal approximation method cannot be used. B. All of the conditions for testing a claim about a population proportion using the normal approximation method are satisfied, so the method can be used. C. The sample observations are not a random sample, so a test about a population proportion using the normal approximating method cannot be used. D. One of…arrow_forwardYou want to test the hypthesis that the mean speed of your cable internet connection is more than 3.1 megabits per second. State the null and alternative hypotheses. Select your answer from one of the following options. a. ?0:?≤3.1 Mb/s??:?>3.1 Mb/s b. ?0:?<3.1 Mb/s??:?≥3.1 Mb/s c. ?0:?=3.1 Mb/s??:?≠3.1 Mb/s d. ?0:?>3.1 Mb/s??:?≤3.1 Mb/s e. ?0:?≥3.1 Mb/s??:?<3.1 Mb/sarrow_forward
arrow_back_ios
SEE MORE QUESTIONS
arrow_forward_ios
Recommended textbooks for you
 MATLAB: An Introduction with ApplicationsStatisticsISBN:9781119256830Author:Amos GilatPublisher:John Wiley & Sons Inc
 Probability and Statistics for Engineering and th...StatisticsISBN:9781305251809Author:Jay L. DevorePublisher:Cengage Learning
 Statistics for The Behavioral Sciences (MindTap C...StatisticsISBN:9781305504912Author:Frederick J Gravetter, Larry B. WallnauPublisher:Cengage Learning
 Elementary Statistics: Picturing the World (7th E...StatisticsISBN:9780134683416Author:Ron Larson, Betsy FarberPublisher:PEARSON
 The Basic Practice of StatisticsStatisticsISBN:9781319042578Author:David S. Moore, William I. Notz, Michael A. FlignerPublisher:W. H. Freeman
 Introduction to the Practice of StatisticsStatisticsISBN:9781319013387Author:David S. Moore, George P. McCabe, Bruce A. CraigPublisher:W. H. Freeman
MATLAB: An Introduction with Applications
Statistics
ISBN:9781119256830
Author:Amos Gilat
Publisher:John Wiley & Sons Inc
Probability and Statistics for Engineering and th...
Statistics
ISBN:9781305251809
Author:Jay L. Devore
Publisher:Cengage Learning
Statistics for The Behavioral Sciences (MindTap C...
Statistics
ISBN:9781305504912
Author:Frederick J Gravetter, Larry B. Wallnau
Publisher:Cengage Learning
Elementary Statistics: Picturing the World (7th E...
Statistics
ISBN:9780134683416
Author:Ron Larson, Betsy Farber
Publisher:PEARSON
The Basic Practice of Statistics
Statistics
ISBN:9781319042578
Author:David S. Moore, William I. Notz, Michael A. Fligner
Publisher:W. H. Freeman
Introduction to the Practice of Statistics
Statistics
ISBN:9781319013387
Author:David S. Moore, George P. McCabe, Bruce A. Craig
Publisher:W. H. Freeman
F- Test or F- statistic (F- Test of Equality of Variance); Author: Prof. Arvind Kumar Sing;https://www.youtube.com/watch?v=PdUt7InTyc8;License: Standard Youtube License
Statistics 101: F-ratio Test for Two Equal Variances; Author: Brandon Foltz;https://www.youtube.com/watch?v=UWQO4gX7-lE;License: Standard YouTube License, CC-BY
Hypothesis Testing and Confidence Intervals (FRM Part 1 – Book 2 – Chapter 5); Author: Analystprep;https://www.youtube.com/watch?v=vth3yZIUlGQ;License: Standard YouTube License, CC-BY
Understanding the Levene's Test for Equality of Variances in SPSS; Author: Dr. Todd Grande;https://www.youtube.com/watch?v=udJr8V2P8Xo;License: Standard Youtube License