Concept explainers
Videos
Personal Consumption Expenditures. The following graph shows the amounts of personal consumption expenditures, in dollars per person per year, in the United States, for four years. The graph also shows the amounts spent on food and on financial services and insurance for those years, labeled as percents of the personal consumption expenditures. Use the graph for Exercises 33–40.
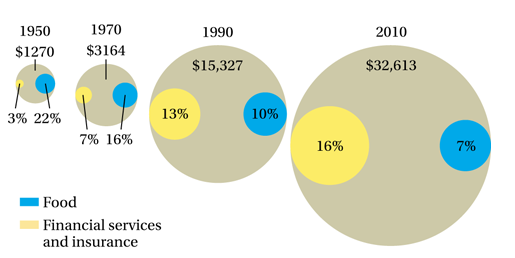
Personal Consumption Expenditures
SOURCE: TIME, October 10, 2011, p. 32; infoplease.com; U.S. Census Bureau
a. How much more, as a percent of personal consumption expenditures, was spent on financial services and insurance in 2010 than in 1950?
b. How much more, in dollars, was spent on financial services and insurance in 2010 than in 1950?
Want to see the full answer?
Check out a sample textbook solution
Chapter 5 Solutions
Developmental Mathematics (9th Edition)


 Mathematics For Machine TechnologyAdvanced MathISBN:9781337798310Author:Peterson, John.Publisher:Cengage Learning,
 Glencoe Algebra 1, Student Edition, 9780079039897...AlgebraISBN:9780079039897Author:CarterPublisher:McGraw Hill
 Holt Mcdougal Larson Pre-algebra: Student Edition...AlgebraISBN:9780547587776Author:HOLT MCDOUGALPublisher:HOLT MCDOUGAL
 Elementary AlgebraAlgebraISBN:9780998625713Author:Lynn Marecek, MaryAnne Anthony-SmithPublisher:OpenStax - Rice University
 Algebra: Structure And Method, Book 1AlgebraISBN:9780395977224Author:Richard G. Brown, Mary P. Dolciani, Robert H. Sorgenfrey, William L. ColePublisher:McDougal Littell