Concept explainers
Videos
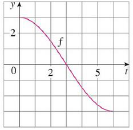
Let
(a) Evaluate g(0) and g(6).
(b) Estimate g(x) for x = 1, 2, 3, 4, and 5.
(c) On what interval is g increasing?
(d) Where does g have a maximum value?
(e) Sketch a rough graph of g.
(f) Use the graph in part (e) to sketch the graph of g′(x). Compare with the graph of f.
Want to see the full answer?
Check out a sample textbook solution
Chapter 5 Solutions
Bundle: Calculus: Early Transcendentals, Loose-Leaf Version, 8th + WebAssign Printed Access Card for Stewart's Calculus: Early Transcendentals, 8th Edition, Multi-Term


- Determine if the statemment is true or false. If the statement is false, then correct it and make it true. If the function f decreases on the interval -,x1 and increases on the interval x1,, then fx1 is a local maximum value.arrow_forwardDetermine if the statemment is true or false. If the statement is false, then correct it and make it true. If the function f increases on the interval -,x1 and decreases on the interval x1,, then fx1 is a local minimum value.arrow_forwardFor the following exercises, consider the graph shown in Figure 16. Estimate the point(s) at which the graph of f has a local maximum or a local minimum.arrow_forward

 College Algebra (MindTap Course List)AlgebraISBN:9781305652231Author:R. David Gustafson, Jeff HughesPublisher:Cengage Learning
 Algebra & Trigonometry with Analytic GeometryAlgebraISBN:9781133382119Author:SwokowskiPublisher:Cengage