
Concept explainers
Videos
To review:
The effect of declining coral population due to highly acidic warm water on the population of fish in the three study areas. Also, give reasons for the occurrence of these changes in the coral population and variations that would occur in these regions.
Given:
Figure 1 shows the study area of the experiment in the Indo-pacific region with high coral reef species. The three sites are Kimbe Bay in Papua New Guinea (PNG), Moorea Island in French Polynesia, and Lizard Island in the Great Barrier Reef on the east coast of Australia.
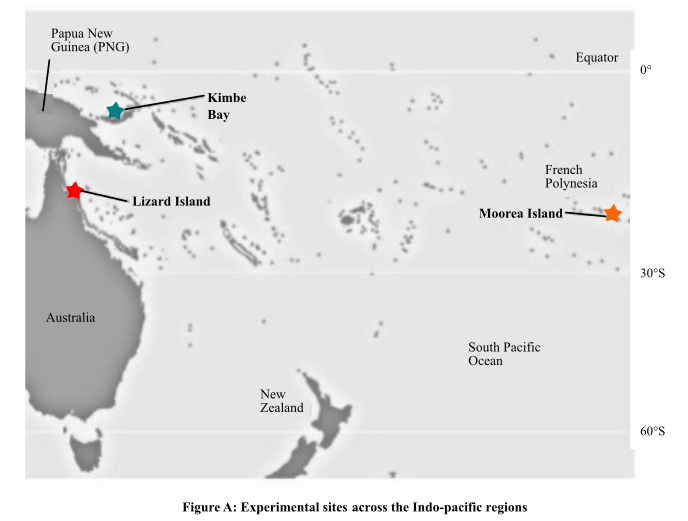
Figure 1: Experimental sites across the Indo-pacific region.
Graph 1 shows the results of the number of fish species found in the coral species region. A relationship was established between the index of sensitivity and the number of coral species.
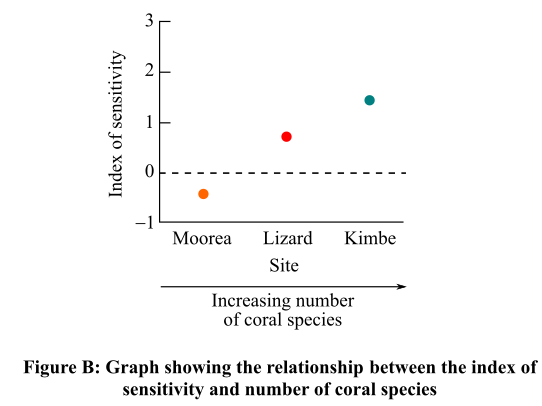
Graph 1: Relationship between the index of sensitivity and number of coral species.
Introduction:
As a result of increased concentration of greenhouse gases in the atmosphere, the acidity of air and water is increasing day-by-day. Global warming, which is again contributed by greenhouse gases, has raised the temperature of oceanic water. These events have impacted the coral reefs to a great extent.
Want to see the full answer?
Check out a sample textbook solution
Chapter 53 Solutions
LIFE:SCIENCE OF BIOL.(LL) >CUSTOM<


- o determine the role of a native starfish species in a coastal ecosystem, zoologist Robert Paine removed starfish from some intertidal pools and not others. He then observed how the community changed in response to the loss of starfish by comparing the diversity of the community in the pools where starfish had been removed to the diversity in pools where he had let the starfish remain. By removing starfish from some pools, what global change driver was Robert Paine investigating? overexploitation pollution climate change invasive species habitat lossarrow_forwardInterpret the following chord diagram that shows the presence of species by month. Which of the following statements best describes the data? Species L Species W 2- Species E The number of different species is greatest in January. W The same two species are present in May, July and September. Species L is the only species found in November. Species W and L are always present in the same months. January March November September May Julyarrow_forwardKeystone predators increase the intensity of competition prey on species at random always prey on the poorest competitors prevent competitive exclusion by preying on competitors are observed only in rocky intertidal zonesarrow_forward
- CA least tern ENDANGERED ANIMAL is CA least tern questionbases on the bird CA least term Reasons for Endangerment Explain the various factors that have led to this species’ current plight. Expand on these points individually, based on your species’ unique story. Domino Effects As we’ve learned, species are not islands unto themselves; they are integrated with many other organisms in trophic relationships, mutualisms, competition, etc. How is the absence of this species (or its lowered population size) likely to impact the other members of its habitat? (If findings specific to this point are available, please include them – otherwise, I’m asking you to speculate based on what you’ve learned about the biology of this organism.) Conservation Efforts Discuss past, current, and proposed efforts to conserve this species. Are these strategies effective? Are they realistic? What is the outlook for this organism?arrow_forwardK P Parchment Exchange - Leader i edgenuity.com/player/ - SC5181 A 7 1 X Unmark this question + 7 8 What would happen to the ecosystem services provided by a coral reef if it were to sustain permanent damage? O The water that would otherwise filter through the coral polyps would become more dense with plankton. O There would be higher concentration of water pollution that could harm other organisms. O Timber production in surrounding land areas would decrease due to the lack of nutrients in the soil. O Humans would have more reason to visit the area in their boats. O 10 M O DELL ✓ Save and Exit 10 Next G<☆ English Sign out Kinley Heath Submit O A Oct 27 10:17 Aarrow_forwardTable 1: The density of dippers (Cinclus cinclus) per km of upper stream length in 18 rivers across Great Britain: the pH of stream water also shown as too their individual territory lengths (km). Data collected with the assistance of the British Trust for Ornithology in May 2001. Draw a graph showing the relationship between dipper density and stream pH. Label the axes and provide a figure legend.arrow_forward
- Crown-of-thorns starfish (often abbreviated as COTS; Acanthaster planci) is one of the largest sea stars in the world. It is also well known as a voracious predator of corals. Sudden outbreaks or swarms of this one species can rapidly consume an entire coral reef. Use internet resources to investigate recent research articles on the topic of crown-of-thorns starfish outbreaks on coral reefs. Where do these outbreaks occur? What impacts do they have on near-shore ecosystems? What causes these outbreaks? What management practices, if any, could be employed in response to COTS outbreaks? Site your sourcesarrow_forwardGiven the data collected by a recent Australian government study on the Great Barrier reef we recognize humans have protected the reef and it is now a model for restoration projects, worldwide. humans are killing the reef through acts of violence so discrete they are unable to be quelled by even military forces. humans are indifferent to the status of the reef. humans are destroying the reef through their own generated pollution. it is a relatively easy task to restore the world landmark.arrow_forwardWhich of the following is an example of biological magnification? O Increasing concentrations of chemicals are present in organisms at higher trophic levels. Explosive expansion of species following an ecological disturbance increase diversity. O Diversification of species depends on the size and continuity of their regional habitat. Members of a species increase in size over time because the largest organisms are more fit. Larger organisms utilize more abiotic resources than smaller organisms.arrow_forward
- Which of the following are important variables that determine the equilibrium number of species in an island (Note: You may choose one or more than one answer. Think wisely.) Distance from mainland Temperature in the island Size of island Distance from equator Humidityarrow_forwardCoral reefs are being threatened and/or damaged by all of the following, except discharge of industrial waste trash warming ocean waters discharge of sewage too much sunlightarrow_forwardExplain the following: Importance of butterflies within an ecosystem Importance of butterflies to humans how humans negatively affect the biodiversity of butterfliesHow change, large and small, has an effect on the ecosystemarrow_forward
 Concepts of BiologyBiologyISBN:9781938168116Author:Samantha Fowler, Rebecca Roush, James WisePublisher:OpenStax College
 Biology Today and Tomorrow without Physiology (Mi...BiologyISBN:9781305117396Author:Cecie Starr, Christine Evers, Lisa StarrPublisher:Cengage Learning