
Biological Science (6th Edition)
6th Edition
ISBN: 9780321976499
Author: Scott Freeman, Kim Quillin, Lizabeth Allison, Michael Black, Emily Taylor, Greg Podgorski, Jeff Carmichael
Publisher: PEARSON
expand_more
expand_more
format_list_bulleted
Videos
Question
Chapter 54, Problem 14PIAT
Summary Introduction
To analyze:
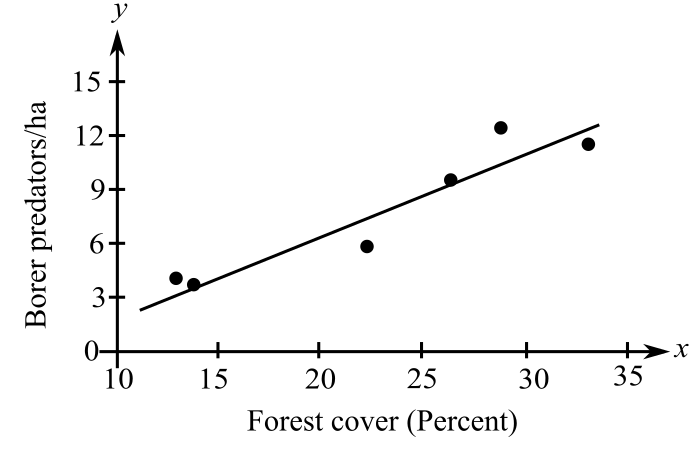
The approximate increase in predators of borers per hectare, if the forest cover is doubled in the graph from 15 to 30 percent.
Introduction:
Borers are predated upon by the birds and other predators. This, in turn, improves the crop production of coffee berries as these are infected by the pests. When the forest cover is increased, it eventually leads to the increased population of birds and other predators of borers. The following graph depicts the relationship between the borer predators per hectare and percentage of forest cover. On the basis of the graph, the increase in the predators per hectare must be calculated.
Expert Solution & Answer
Want to see the full answer?
Check out a sample textbook solution
Students have asked these similar questions
With the help of suitable diagram describe the logistic population growth curve.
Describe what a pyramid of numbers would like if an ecologist models the relationship between bird parasites, blue jays, and oak trees in a hectare. Does this match the energy flow pyramid?
Compare/contrast K and r - selected species. Discuss their population growth curves.
Knowledge Booster


Learn more about
Need a deep-dive on the concept behind this application? Look no further. Learn more about this topic, biology and related others by exploring similar questions and additional content below.Similar questions
- Describe the growth at various parts of the S-shaped curve of logistic growth.arrow_forwardThese data were collected over a 5-year period for a perennial compass plant. What is the rate of growth of the population if the carrying capacity is 1000 (using 202 for starting population size)? What is the fastest rate of growth possible for this population?arrow_forwardMake a claim regarding the decreasing deforestation of the Brazilian rainforest from 2001-2013. Cite TWO pieces of data that support your claim. Explain your reasoning.arrow_forward
- Suppose that blue sheep are the most important prey of snow leopard, and that the predator‒prey interaction follows Lotka‒Volterra dynamics. The mortality rate of snow leopard in the absence of blue sheep is 0.1 per week, and the intrinsic growth rate of blue sheep in the absence of snow leopard predation is 0.2 per week. Snow leopard capture efficiency is 0.002, and the efficiency at which blue sheep biomass is converted into snow leopard biomass is 0.2. If there are initially 30 snow leopards and 400 blue sheep, the overall rate of change in the blue sheep population will be a gain of ____ per week.arrow_forwardBased on the graph below what is the carrying capacity for the species represented by the orange linearrow_forwardA) Summarize what the data show concerning the change in productivity and mortality of the Amazon rainforest from 1980 to 2015. B) What consequences does this have on the global carbon cycle and climate change?arrow_forward
- Give typing answer with explanation and conclusion 1. Which of the following is most likely to increase the carrying capacity of an area for an organism? Choose ALL that apply A. Creating a migration corridor between patches of suitable habitat B. Harvesting the organism to reduce the population C. Eliminating a disease from the area D. Food source increases E. Climate change causing a mutualist to migrate out of the habitatarrow_forwardThe gross primary productivity is 100 g/m2/year and the respiration rate is 57 g/m2/year . If the standing crop (of plants) in the above question is 145 g/m2 what will the standing crop (of plants) be a year later, assuming no death/predation? Group of answer choices can't tell from the information given a. 188 g/m2 b. 145 g/m2 c. 245 g/m2 d. 182 g/m2arrow_forwardSUBJECT : Biology - Ecology How would you describe the slope of a rank-abundance curve that vary with increasing species evenness?arrow_forward
- Biology Question! Water wisteria is an aquatic plant that is easy to care for and reproduces very quickly. A small man-made pond of 350 L contains 78 water wisteria plants. 15 new plants are introduced daily to the pond, while 50 plants are taken out once a week to be sold at local pet shops. What is the overall population change in a two-week period? Express your answer rounded to the nearest whole number. What is the population density of water wisteria at the beginning? Express your answer as a value between 0 and 1 rounded to two decimal places.arrow_forwardConsidering the energy that is lost as heat to the environment when one organism consumes another, which model correctly shows the trophic levels ranked from greatest energy to least?arrow_forwardThe logistic model incorporates carrying capacity to make the model exponentialarrow_forward
arrow_back_ios
SEE MORE QUESTIONS
arrow_forward_ios
Recommended textbooks for you
 Biology (MindTap Course List)BiologyISBN:9781337392938Author:Eldra Solomon, Charles Martin, Diana W. Martin, Linda R. BergPublisher:Cengage Learning
 Concepts of BiologyBiologyISBN:9781938168116Author:Samantha Fowler, Rebecca Roush, James WisePublisher:OpenStax College
Biology (MindTap Course List)
Biology
ISBN:9781337392938
Author:Eldra Solomon, Charles Martin, Diana W. Martin, Linda R. Berg
Publisher:Cengage Learning
Concepts of Biology
Biology
ISBN:9781938168116
Author:Samantha Fowler, Rebecca Roush, James Wise
Publisher:OpenStax College
5 Human Impacts on the Environment: Crash Course Ecology #10; Author: CrashCourse;https://www.youtube.com/watch?v=5eTCZ9L834s;License: Standard YouTube License, CC-BY
Aquatic Ecosystems; Author: Ocean Research & Conservation Association (ORCA);https://www.youtube.com/watch?v=4tU08jCvwGg;License: Standard YouTube License, CC-BY
Aquatic Ecosystems; Author: David Akerman;https://www.youtube.com/watch?v=9T6Q2I_kPeo;License: Standard Youtube License