
Concept explainers
Videos
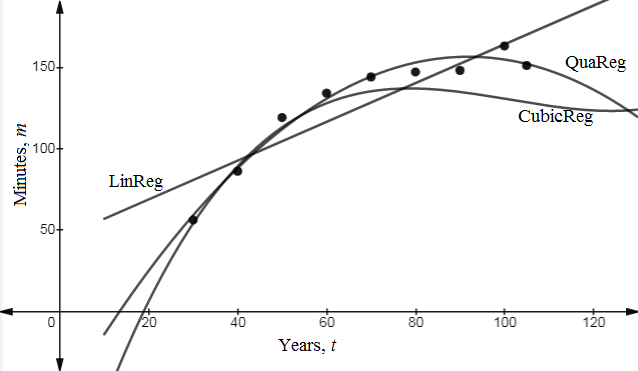
To find: The best fit curve of the data.
Answer to Problem 2E
Explanation of Solution
Given:The table shows number minutes out of 8 hours work day.
In table shows number of minutes out of each eight- hour work day for various years.
Let t =30 represents year corresponding to 1930.
Now plot the scatter plot and draw each regression on graph.
Using graph the equation of regression,
Linear regression,
Quadratic regression,
Cubic regression,
So, coefficient of regression constant is nearest to 1 for cubic regression. Best fit curve would be cubic.
Hence, the best fit curve for the given data is cubic,
Chapter 5 Solutions
Glencoe Algebra 2 Student Edition C2014
Additional Math Textbook Solutions
College Algebra
Linear Algebra and Its Applications (5th Edition)
College Algebra (7th Edition)
Thomas' Calculus: Early Transcendentals (14th Edition)


 Algebra and Trigonometry (6th Edition)AlgebraISBN:9780134463216Author:Robert F. BlitzerPublisher:PEARSON
 Contemporary Abstract AlgebraAlgebraISBN:9781305657960Author:Joseph GallianPublisher:Cengage Learning
 Linear Algebra: A Modern IntroductionAlgebraISBN:9781285463247Author:David PoolePublisher:Cengage Learning
 Algebra And Trigonometry (11th Edition)AlgebraISBN:9780135163078Author:Michael SullivanPublisher:PEARSON
 Introduction to Linear Algebra, Fifth EditionAlgebraISBN:9780980232776Author:Gilbert StrangPublisher:Wellesley-Cambridge Press
 College Algebra (Collegiate Math)AlgebraISBN:9780077836344Author:Julie Miller, Donna GerkenPublisher:McGraw-Hill Education