
Concept explainers
Videos
To sketch: the graph of a given function f ( x ). And to identify the real zeros, maximum and minimum points, number and type of zeros, y-intercepts and symmetry.
Explanation of Solution
Given Information:A function
Graph:The function

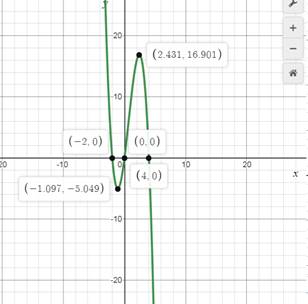
Interpretation: From the graph, the following information can be obtained.
(1) The zeros of the function are those values of x for which the function becomes zero. The given function has three zeros, all of which being real. They are
(2) The maximum point of the function is reached for a particular value of x . Here, the maximum value of the function is 16.901 and it is reached at the value of
(3) The point where the curve crosses the y-axis is the y-intercept. Here, the y-intercept is (0,0).
(4)As observed from the graph, the given function is asymmetric in nature with respect to both the axes.
Chapter 5 Solutions
Glencoe Algebra 2 Student Edition C2014
Additional Math Textbook Solutions
Linear Algebra and Its Applications (5th Edition)
College Algebra (7th Edition)
College Algebra


 Algebra and Trigonometry (6th Edition)AlgebraISBN:9780134463216Author:Robert F. BlitzerPublisher:PEARSON
 Contemporary Abstract AlgebraAlgebraISBN:9781305657960Author:Joseph GallianPublisher:Cengage Learning
 Linear Algebra: A Modern IntroductionAlgebraISBN:9781285463247Author:David PoolePublisher:Cengage Learning
 Algebra And Trigonometry (11th Edition)AlgebraISBN:9780135163078Author:Michael SullivanPublisher:PEARSON
 Introduction to Linear Algebra, Fifth EditionAlgebraISBN:9780980232776Author:Gilbert StrangPublisher:Wellesley-Cambridge Press
 College Algebra (Collegiate Math)AlgebraISBN:9780077836344Author:Julie Miller, Donna GerkenPublisher:McGraw-Hill Education