
Concept explainers
Videos
Mammogram diagnostics Breast cancer is the most common form of cancer in women, affecting about 10% of women at some time in their lives. There is about a 1% chance of having breast cancer at a given time (that is, P(S) = 0.01 for the state of having breast cancer at a given time). The chance of breast cancer increases as a woman ages, and the American Cancer Society recommends an annual mammogram after age 40 to test for its presence. Of the women who undergo mammograms at any given time, about 1% are typically estimated to actually have breast cancer. The likelihood of a false test result varies according to the breast density and the radiologist’s level of experience. For use of the mammogram to detect breast cancer, typical values reported are sensitivity = 0.86 and specificity = 0.88.
- a. Construct a tree diagram in which the first set of branches shows whether a woman has breast cancer and the second set of branches shows the mammogram result. At the end of the final set of branches, show that P(S and POS) = 0.01 × 0.86 = 0.0086 and report the other intersection probabilities also.
- b. Restricting your attention to the two paths that have a positive test result, show that P(POS) = 0.1274.
- c. Of the women who receive a positive mammogram result, what proportion actually have breast cancer?
- d. The following tree diagram illustrates how P(S|POS) can be so small, using a typical group of 100 women who have a mammogram. Explain how to get the frequencies shown on the branches and why this suggests that P(S|POS) is only about 0.08.
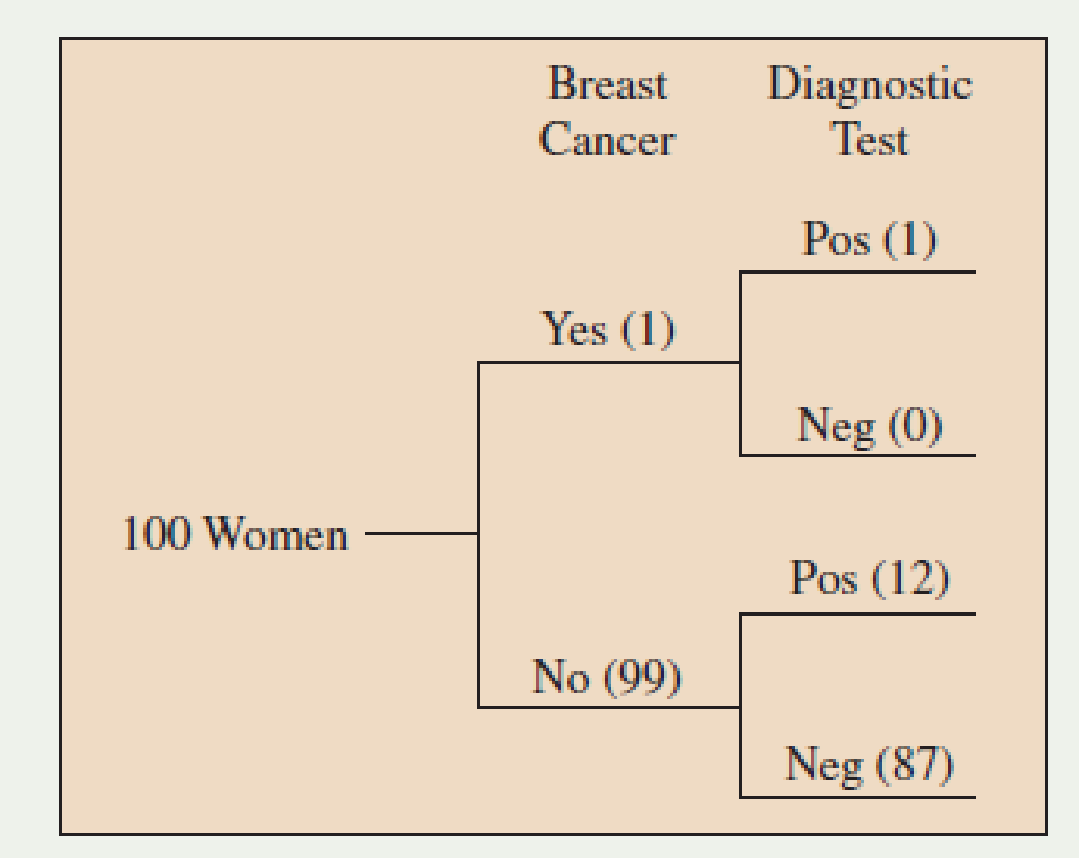
Typical results of mammograms for 100 women
Want to see the full answer?
Check out a sample textbook solution
Chapter 5 Solutions
Statistics: The Art and Science of Learning from Data (4th Edition)


- Population Genetics In the study of population genetics, an important measure of inbreeding is the proportion of homozygous genotypesthat is, instances in which the two alleles carried at a particular site on an individuals chromosomes are both the same. For population in which blood-related individual mate, them is a higher than expected frequency of homozygous individuals. Examples of such populations include endangered or rare species, selectively bred breeds, and isolated populations. in general. the frequency of homozygous children from mating of blood-related parents is greater than that for children from unrelated parents Measured over a large number of generations, the proportion of heterozygous genotypesthat is, nonhomozygous genotypeschanges by a constant factor 1 from generation to generation. The factor 1 is a number between 0 and 1. If 1=0.75, for example then the proportion of heterozygous individuals in the population decreases by 25 in each generation In this case, after 10 generations, the proportion of heterozygous individuals in the population decreases by 94.37, since 0.7510=0.0563, or 5.63. In other words, 94.37 of the population is homozygous. For specific types of matings, the proportion of heterozygous genotypes can be related to that of previous generations and is found from an equation. For mating between siblings 1 can be determined as the largest value of for which 2=12+14. This equation comes from carefully accounting for the genotypes for the present generation the 2 term in terms of those previous two generations represented by for the parents generation and by the constant term of the grandparents generation. a Find both solutions to the quadratic equation above and identify which is 1 use a horizontal span of 1 to 1 in this exercise and the following exercise. b After 5 generations, what proportion of the population will be homozygous? c After 20 generations, what proportion of the population will be homozygous?arrow_forwardConditional probability About 25 of the population watches the evening television news coverage as well as the soap operas. If 75 of the population watches the news, what percent of those who watch the news also watch the soaps?arrow_forwardUse this data for the exercises that follow: In 2013, there were roughly 317 million citizens in the United States, and about 40 million were elderly (aged 65 and over).[34] 60. It is predicted that by 2030, one in five U.S. citizens will be elderly. How much greater will the chances of meeting an elderly person be at that time? What policy changes do you foresee if these statistics hold true?arrow_forward
 Functions and Change: A Modeling Approach to Coll...AlgebraISBN:9781337111348Author:Bruce Crauder, Benny Evans, Alan NoellPublisher:Cengage Learning
 Linear Algebra: A Modern IntroductionAlgebraISBN:9781285463247Author:David PoolePublisher:Cengage Learning
 College Algebra (MindTap Course List)AlgebraISBN:9781305652231Author:R. David Gustafson, Jeff HughesPublisher:Cengage Learning
 Holt Mcdougal Larson Pre-algebra: Student Edition...AlgebraISBN:9780547587776Author:HOLT MCDOUGALPublisher:HOLT MCDOUGAL
 Trigonometry (MindTap Course List)TrigonometryISBN:9781337278461Author:Ron LarsonPublisher:Cengage Learning