
Videos
Angioplasty is a medical procedure in which an obstructed blood vessel is widened. In some cases, a wire mesh tube, called a stent, is placed in the vessel to help it remain open. The article “Long-term Outcomes of Patients Receiving Drug-eluting Stents” (A. Philpott, D. Southern, et al., Canadian Medical Association Journal, 2009:167–174) presents the results of a study comparing the effectiveness of a bare metal stent with one that that has been coated with a drug designed to prevent reblocking of the vessel. A total of 5320 patients received bare metal stents, and of these, 841 needed treatment for reblocking within a year. A total of 1120 received drug coated stents, and 134 of them required treatment within a year.
- a. Find a 98% confidence interval for the differences between the proportions for drug coated stents and bare metal stents.
- b. Suppose that additional patients are to be treated in order to increase the precision of the confidence interval. Three sampling plans are being considered. In the first plan, 1000 additional patients will be treated with bare metal stents. In the second plan, 500 additional patients will be treated with drug coated stents. In the third plan, 500 additional patients will be treated with bare metal stents and 250 additional patients will be treated with drug coated stents. Which plan is most likely to provide the greatest increase in the precision of the confidence interval? Explain.
a.
Find the 98% confidence interval for the difference between the proportions for drug coated stents and bare metal stents.
Answer to Problem 3E
The 98% confidence interval for the difference between the proportions for drug coated stents and bare metal stents is
Explanation of Solution
Given info:
Calculation:
Proportion:
The value of proportion is,
Confidence interval:
Step-by-step procedure to obtain the confidence interval using the MINITAB software:
- Choose Stat > Basic Statistics > 2 Proportion.
- Choose Summarized data.
- In First sample, enter Number of events, enter 842 and enter Number of trials, enter 5322.
- In Second sample, enter Number of events, enter 135 and enter Number of trials, enter 1,122.
- Check Options; enter Confidence level as 98%.
- Choose not equal in alternative.
- Click OK.
Output using the MINITAB software is given below:
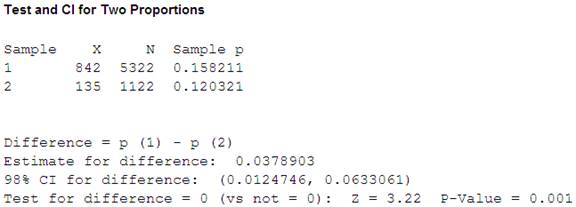
From the MINITAB output, the 98% confidence interval for the difference between the proportions for drug coated stents and bare metal stents is
b.
Identify which plan is most likely to provide the greatest increase in the precision of the confidence interval.
Answer to Problem 3E
The second plan 500 additional patients will be treated with drug coated stents is most likely to provide the greatest increase in the precision of the confidence interval.
Explanation of Solution
Calculation:
If the 1,000 additional patients will be treated with bare metal stents, then
The standard deviation for the difference between the proportions is,
The width of 98% confidence interval is,
If the 500 additional patients will be treated with drug coated stents, then
The standard deviation for the difference between the proportions is,
The width of 98% confidence interval is,
If the 500 additional patients will be treated with bare metal stents and 250 additional patients will be treated with drug coated stents, then
The standard deviation for the difference between the proportions is,
The width of 98% confidence interval is,
From the result, it can be observed that the width of 98% confidence interval for second plan is lesser when compared to other two plans. Hence, the second plan 500 additional patients will be treated with drug coated stents is most likely to provide the greatest increase in the precision of the confidence interval.
Want to see more full solutions like this?
Chapter 5 Solutions
Statistics for Engineers and Scientists - With Access


- Leisure Activities and Dementia. An article appearing in the Los Angeles Times discussed the study “Leisure Activities and the Risk of Dementia in the Elderly” (New England Journal of Medicine, Vol. 348) by J.Verghese et al. The article in the Times, titled “Crosswords Reduce Risk of Dementia,” contained the following statement: “Elderly people who frequently read, do crossword puzzles, practice a musical instrument or play board games cut their risk of Alzheimer’s and other forms of dementia by nearly two-thirds compared with people who seldom do such activities.” Comment on thestatement in quotes, keeping in mind the type of study for which causation can be reasonably inferred.arrow_forwardThe article “Treadmill Exercise and Resistance Training in Patients With Peripheral Arterial Disease With and Without Intermittent Claudication. A Randomized Controlled Trial” (M. McDermott, P. Ades, et al., Journal of the American Medical Association, 2009:165–174) reported the results of a study to determine whether treadmill exercise could improve the walking ability of patients suffering from claudication, which is pain caused by insufficient blood flow to the muscles of the legs. A sample of 48 patients walked on a treadmill for six minutes every day. After six months, the mean distance walked in six minutes was 348 m, with a standard deviation of 80 m. For a control group of 46 patients who did not walk on a treadmill, the mean distance was 309 m with a standard deviation of 89 m. Find a 95% confidence interval for the difference in mean distance walked between the two groups of patients.arrow_forwardReviewers from the Oregon Evidence-Based Practice Center at the Oregon Health and Science University investigated the effectiveness of prescription drugs in assisting people to fall asleep and stay asleep (source: S. Carson, M.S. McDonagh, et al., “Drug class review: Newer drugs for insomnia,” Oregon Health and Science University, 2008, http://www.ncbi.nlm.nih.gov). Suppose a study of two drugs, Sonata and Ambien, was conducted and the resulting data are contained in a file titled Shuteye. The samples reflect an experiment in which individuals were randomly given the two brands of pills on separate evenings. Their time spent sleeping was recorded for each of the brands of sleeping pills. (A) Does the experiment seem to have dependent or independent samples? Explain your reasoning. (B) Do the data indicate that there is a statistical difference in the mean time spent sleeping for people using the two drugs? Test using alpha = 0.02. Conduct a statistical procedure to determine this. (C)…arrow_forward
- Landolt et al. (A-26) examined rates of posttraumatic stress disorder (PTSD) in mothers and fathers. Parents were interviewed 5 to 6 weeks after an accident or a new diagnosis of cancer or diabetes mellitus type I for their child. Twenty-eight of the 175 fathers interviewed and 43 of the 180 mothers interviewed met the criteria for current PTSD. Is there sufficient evidence for us to conclude that fathers are less likely to develop PTSD than mothers when a child is traumatized by an accident, cancer diagnosis, or diabetes diagnosis? Let alpha = 0.05arrow_forwardA U.S. study published in The American Journal of Preventive Medicine compared state-level prevalence of firearm ownership in 2002 with state-level rates of firearm assault and firearm robbery in the subsequent year. The investigators found a positive association - meaning that states with higher prevalence of firearm ownership also tended to be the states with higher rates of firearm assault. Which design best describes this study? a)Observational cohort study b)Randomized trial c)Case-control study d)Ecological studyarrow_forwardThe Diabetes Control and Complications trial research group, randomly assigned volunteers with type 1 (insulin-dependent) diabetes mellitus, but without retinopathy, either to a conventional treatment or to a more intensive treatment aimed at maintaining normal blood glucose levels. The volunteers' health was monitored closely for approximately six years. By the end of the study, 91 patients out of 378 in the conventional treatment group had developed retinopathy, whereas 23 out of 348 in the intensive treatment group had developed retinopathy. Test whether the rates of retinopathy differed significantly between the two treatment groups, if they did, which rate was significantly lower. 1. Provide the null hypothesis 2. Provide the alternative hypotheses 3. calculate the appropriate test statistic. Show all work 4. Identify the p-value for that test statistic 5. Using the p-value method and an alpha level of 0.02 state what your conclusions are regarding the null hypothesis, and…arrow_forward
- The Diabetes Control and Complications trial research group, randomly assigned volunteers with type 1 (insulin-dependent) diabetes mellitus, but without retinopathy, either to a conventional treatment or to a more intensive treatment aimed at maintaining normal blood glucose levels. The volunteers' health was monitored closely for approximately six years. By the end of the study, 91 patients out of 378 in the conventional treatment group had developed retinopathy, whereas 23 out of 348 in the intensive treatment group had developed retinopathy. Test wether the rates of retionpathy differed significantly betweenthe two treatment groups, if they did, which rate was significantly lower. 1. Provide the null hypothesis 2. Provide the alternative hypotheses 3. calculate the appropriate test statistic. Show all work 4. Indentify the p-value for that test statistic 5. Using the p-vlaue method and an alpha level of 0.02 state what your conclusions is regarding the null hypothesis, and…arrow_forwardNCI Cancer Bulletin, December 2, 2008 Volume 5 / Number 24 Title of the article: After Menopause, Weight Affects Breast Cancer Rates More than Mammography Use Women who are overweight or obese after menopause face an increased risk of breast cancer, but a large prospective cohort study indicates that the frequency of mammography use and screening accuracy are not the primary explanations for higher rates of breast cancer in these women. The same is true of large, invasive breast cancer tumors and advanced stage disease; risk increases with weight, but higher rates are not explained by the frequency or accuracy of screening mammography before breast cancer was diagnosed. The study appears in the December 3 Journal of the National Cancer Institute. Dr. Karla Kerlikowske of the San Francisco Veterans Affairs Medical Center and colleagues gathered data on 287,115 postmenopausal women who were registered in the Breast Cancer Surveillance Consortium database. Reflecting a trend in the…arrow_forwardNCI Cancer Bulletin, December 2, 2008 Volume 5 / Number 24 Title of the article: After Menopause, Weight Affects Breast Cancer Rates More than Mammography Use Women who are overweight or obese after menopause face an increased risk of breast cancer, but a large prospective cohort study indicates that the frequency of mammography use and screening accuracy are not the primary explanations for higher rates of breast cancer in these women. The same is true of large, invasive breast cancer tumors and advanced stage disease; risk increases with weight, but higher rates are not explained by the frequency or accuracy of screening mammography before breast cancer was diagnosed. The study appears in the December 3 Journal of the National Cancer Institute. Dr. Karla Kerlikowske of the San Francisco Veterans Affairs Medical Center and colleagues gathered data on 287,115 postmenopausal women who were registered in the Breast Cancer Surveillance Consortium database. Reflecting a trend in the…arrow_forward
- NCI Cancer Bulletin, December 2, 2008 Volume 5 / Number 24 Title of the article: After Menopause, Weight Affects Breast Cancer Rates More than Mammography Use Women who are overweight or obese after menopause face an increased risk of breast cancer, but a large prospective cohort study indicates that the frequency of mammography use and screening accuracy are not the primary explanations for higher rates of breast cancer in these women. The same is true of large, invasive breast cancer tumors and advanced stage disease; risk increases with weight, but higher rates are not explained by the frequency or accuracy of screening mammography before breast cancer was diagnosed. The study appears in the December 3 Journal of the National Cancer Institute. Dr. Karla Kerlikowske of the San Francisco Veterans Affairs Medical Center and colleagues gathered data on 287,115 postmenopausal women who were registered in the Breast Cancer Surveillance Consortium database. Reflecting a trend in the…arrow_forwardNCI Cancer Bulletin, December 2, 2008 Volume 5 / Number 24 Title of the article: After Menopause, Weight Affects Breast Cancer Rates More than Mammography Use Women who are overweight or obese after menopause face an increased risk of breast cancer, but a large prospective cohort study indicates that the frequency of mammography use and screening accuracy are not the primary explanations for higher rates of breast cancer in these women. The same is true of large, invasive breast cancer tumors and advanced stage disease; risk increases with weight, but higher rates are not explained by the frequency or accuracy of screening mammography before breast cancer was diagnosed. The study appears in the December 3 Journal of the National Cancer Institute. Dr. Karla Kerlikowske of the San Francisco Veterans Affairs Medical Center and colleagues gathered data on 287,115 postmenopausal women who were registered in the Breast Cancer Surveillance Consortium database. Reflecting a trend in the…arrow_forwardStressed-Out Bus Drivers. Previous studies have shown that urban bus drivers have an extremely stressful job, and a large proportion of drivers retire prematurely with disabilities due to occupational stress. In the paper, “Hassles on the Job: A Study of a Job Intervention With Urban Bus Drivers” (Journal of Organizational Behavior, Vol. 20, pp. 199–208), G. Evans et al. examined the effects of an intervention program to improve the conditions of urban bus drivers.Amongother variables, the researchers monitored diastolic blood pressure of bus drivers in downtown Stockholm, Sweden. The data, in millimeters of mercury (mm Hg), on the WeissStats site are based on the blood pressures obtained prior to intervention for the 41 bus drivers in the study. Use the technology of your choice to do the following. a. Obtain a normal probability plot, boxplot, histogram, and stemand-leaf diagram of the data. b. Based on your results from part (a), can you reasonably apply the one-mean t-test to the…arrow_forward
 MATLAB: An Introduction with ApplicationsStatisticsISBN:9781119256830Author:Amos GilatPublisher:John Wiley & Sons Inc
 Probability and Statistics for Engineering and th...StatisticsISBN:9781305251809Author:Jay L. DevorePublisher:Cengage Learning
 Statistics for The Behavioral Sciences (MindTap C...StatisticsISBN:9781305504912Author:Frederick J Gravetter, Larry B. WallnauPublisher:Cengage Learning
 Elementary Statistics: Picturing the World (7th E...StatisticsISBN:9780134683416Author:Ron Larson, Betsy FarberPublisher:PEARSON
 The Basic Practice of StatisticsStatisticsISBN:9781319042578Author:David S. Moore, William I. Notz, Michael A. FlignerPublisher:W. H. Freeman
 Introduction to the Practice of StatisticsStatisticsISBN:9781319013387Author:David S. Moore, George P. McCabe, Bruce A. CraigPublisher:W. H. Freeman